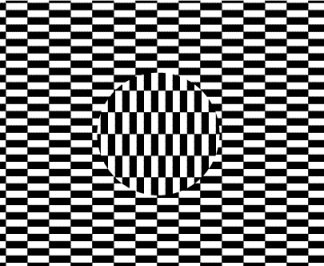
A textured Ouchi Illusion

The Ouchi illusion is a powerful demonstration that static images may produce an illusory movement. One striking aspect is that it makes you feel quite dizzy from trying to compensate for this illusory movement.

ouchi.jpg

The illlusion is is generated by your own eye movements and is a consequence of the aperture problem, which is a fundamental problem in vision science. The aperture problem is the fact that the visual system can only integrate information along the direction of motion, and not perpendicular to it. This is because the visual system is made of a set of filters that are oriented in different directions, and the integration is done by summing the responses of these filters. The aperture problem is a problem because it means that the visual system cannot recover the direction of motion of a contour from the responses of these filters.

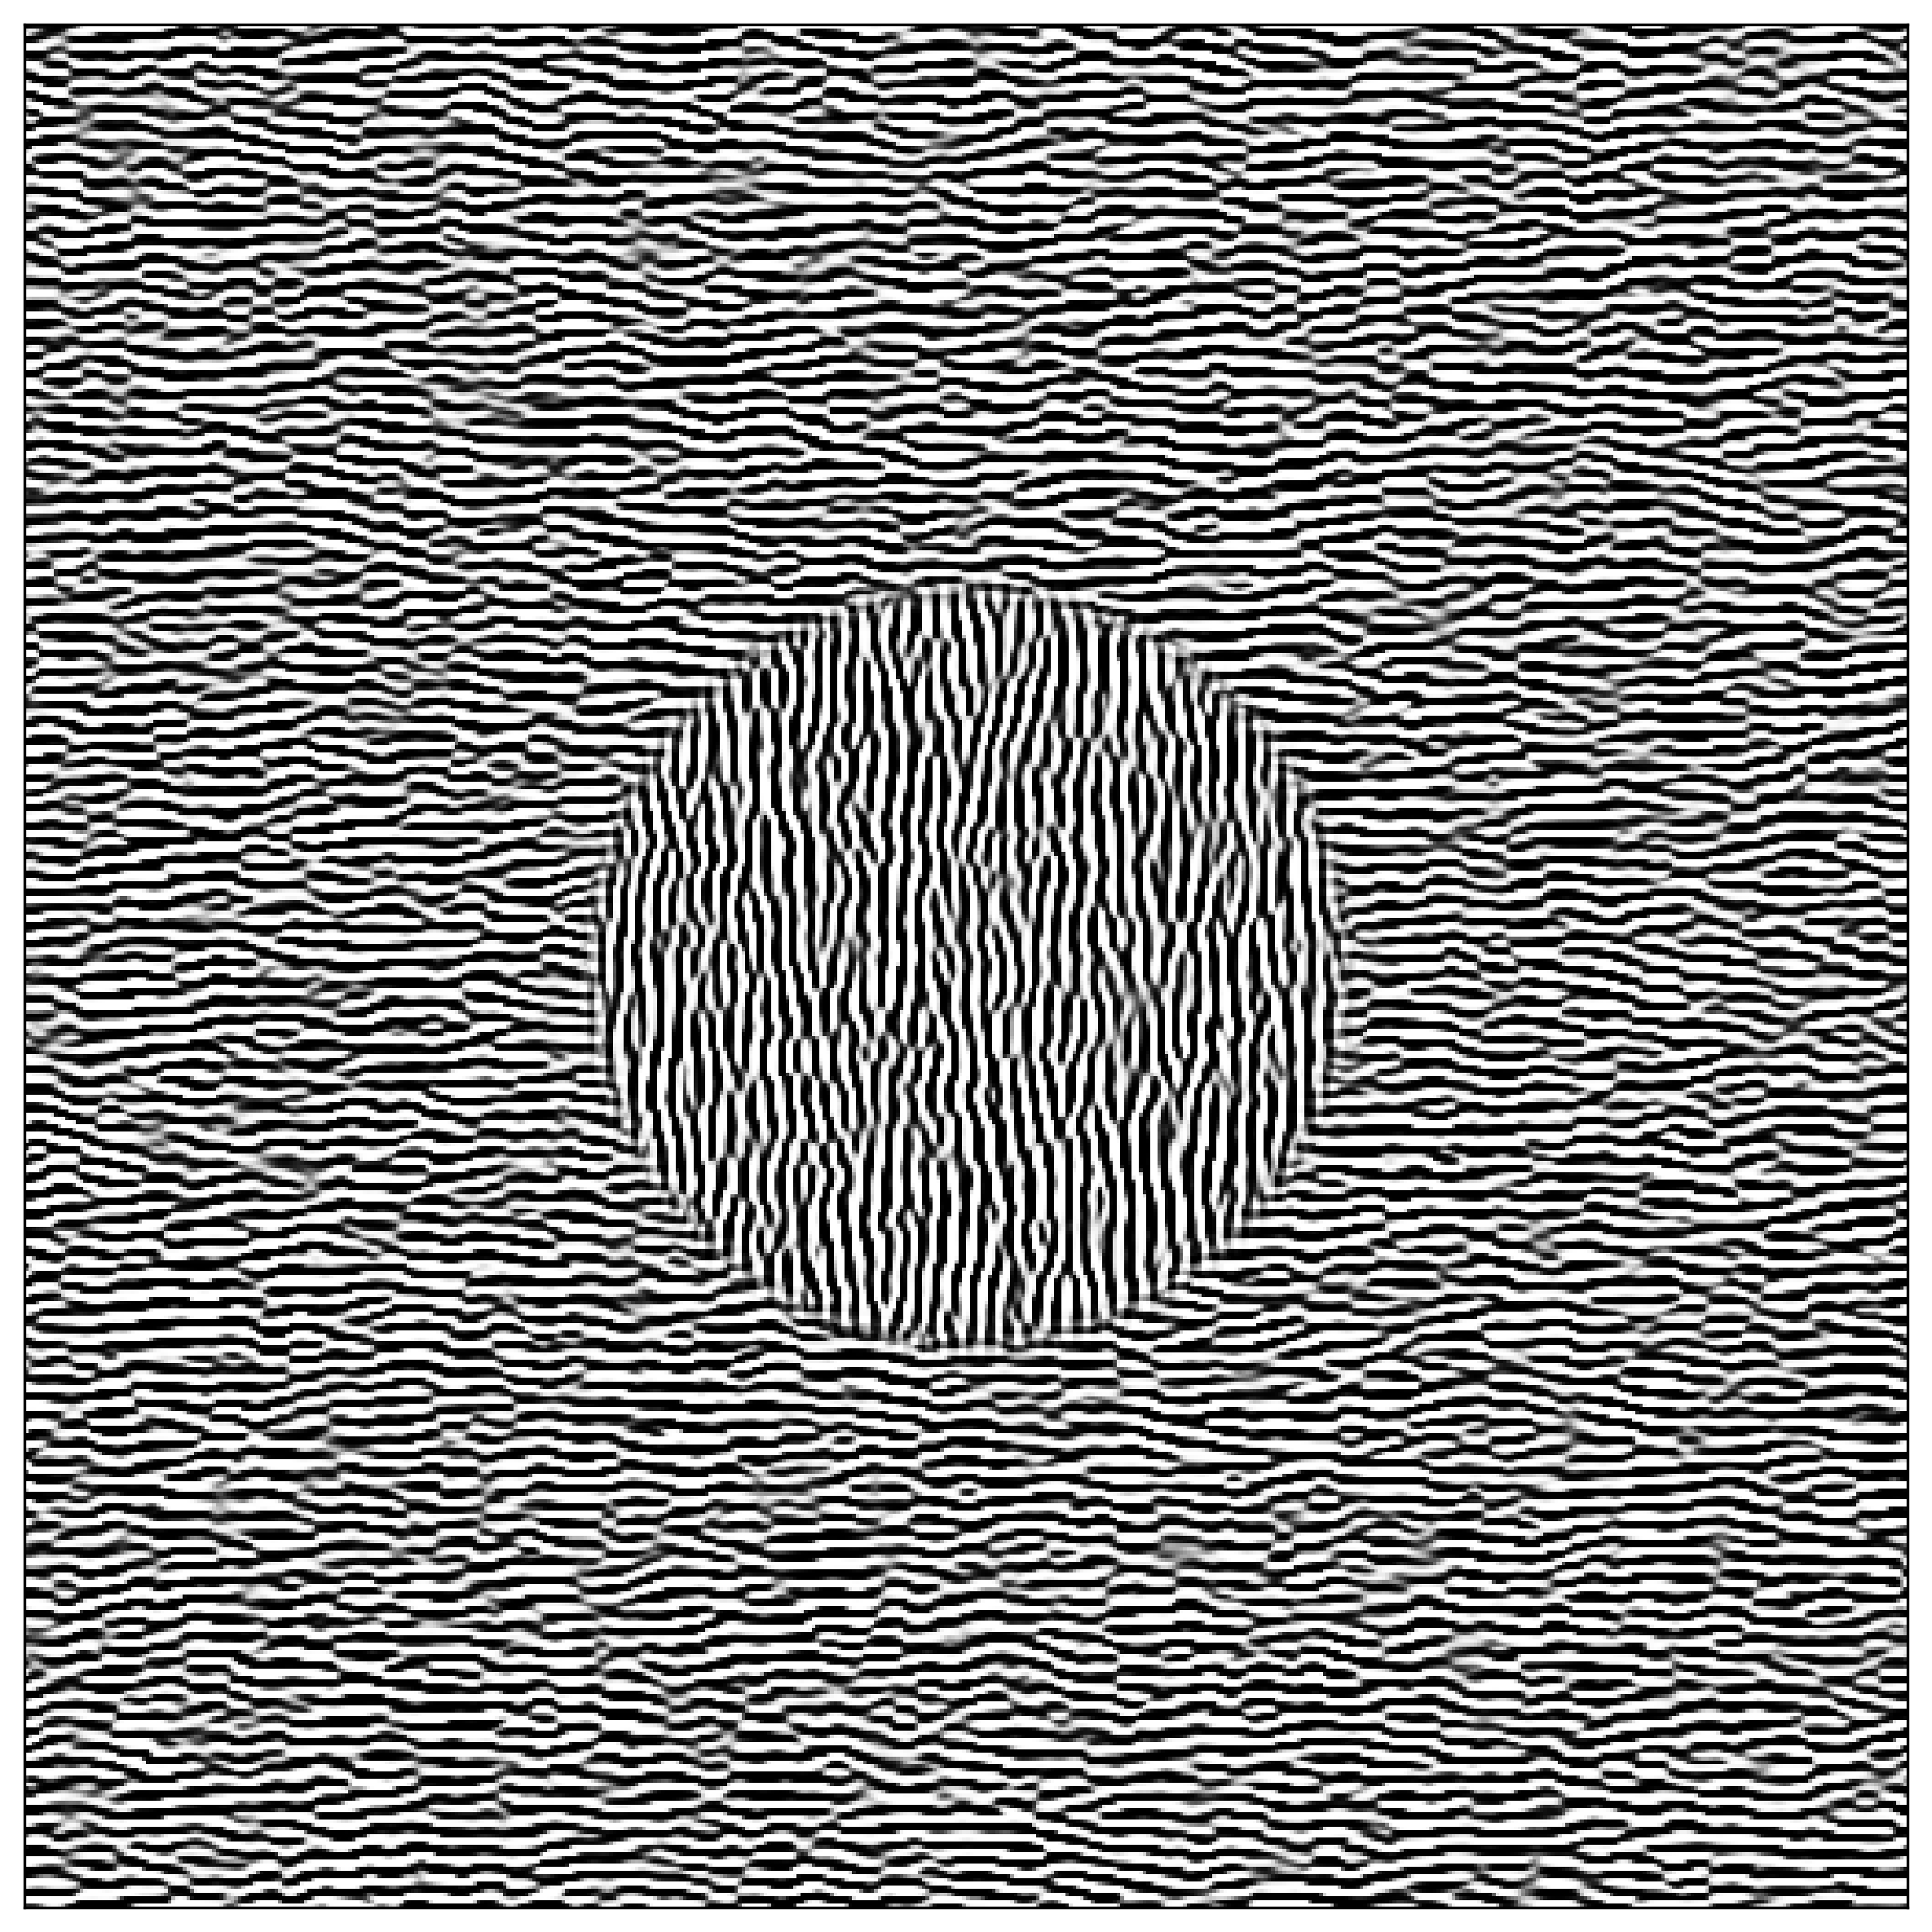
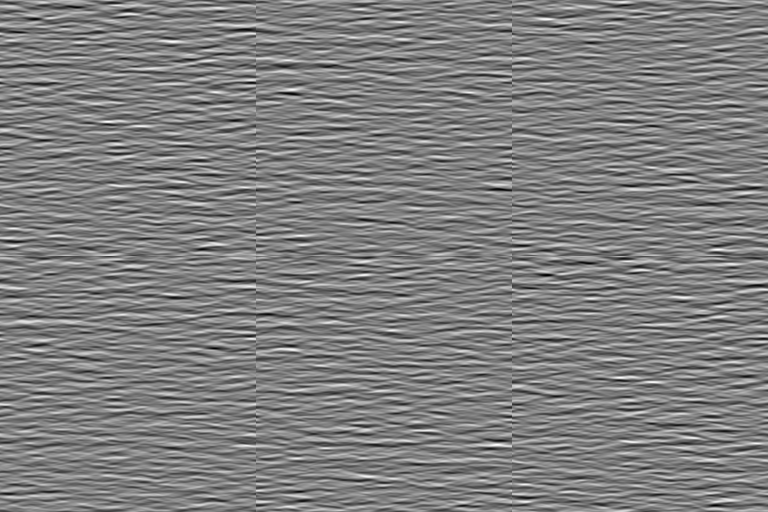
Here, we explore variations of this illusion which xwould use textures instead of regular angles using the MotionClouds library. The idea is to use the same texture in the two parts of the image (center vs surround), but to rotate by 90° the texture in the center:

my sweet ouchi

Optimizing the parameters of the texture would help tell us what matters to generate that illusion...

Read more…

Modelling wind ripples

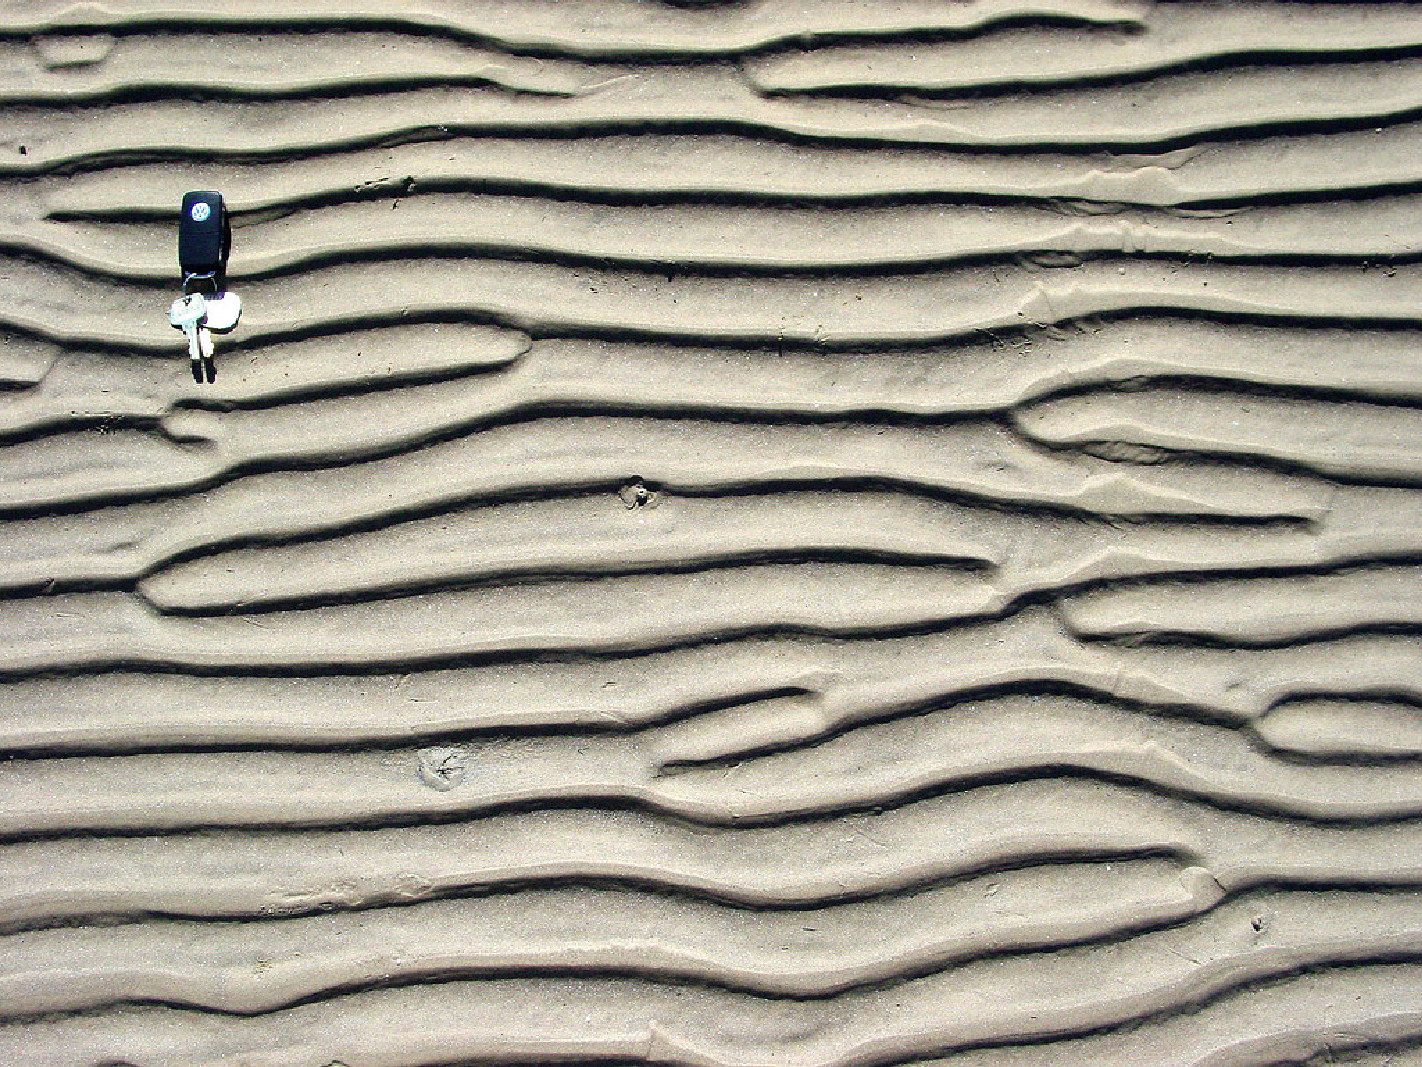
Here, I try to simulate the patterns obtained on a sandy terrain. This is what is observed when the wind blows on the dry surface of a land with sand or also on the surface of the sea in the presence of currents.

As described in https://en.wikipedia.org/wiki/Dune,

When a sandy seabed is subject to wave action and the wave orbital motion is strong enough to move sand grains, ripples often appear. The ripples induced by wave action are called “wave ripples”; their characteristics being different from those of the ripples generated by steady flows. The most striking difference between wave ripple fields and current ripple fields is the regularity of the former. Indeed, regular long-crested wave ripple fields are often observed on tidal beaches from which the sea has withdrawn at low water (see figure 1).

A nice example is shown in http://www.coastalwiki.org/wiki/Wave_ripple_formation showing

Ripples observed at Sea Rim State Park, along the coast of east Texas close to the border with Louisiana (courtesy by Zoltan Sylvester).

Wave ripple formation

An interesting aspect of that patterns is that they may occur at different scales, like taht example on the surface of the Mars planet:

Overview of large sand wave field and high-resolution difference map of two surveys approximately 21 hours apart illustrating both large-scale and small-scale sand wave migration and orientation. Migration is from right to left.

Read more…

Implementing a retinotopic transform using `grid_sample` from pyTorch

Implementing a retinotopic transform using grid_sample from pyTorch

The grid_sample transform is a powerful function which allows to transform any input image into a new topology. It is notably used in Spatial Transformer Networks for instance to learn CNN to be invariant to affine transforms. We used it recently in a publication What You See Is What You Transform: Foveated Spatial Transformers as a Bio-Inspired Attention Mechanism by Ghassan Dabane et al.

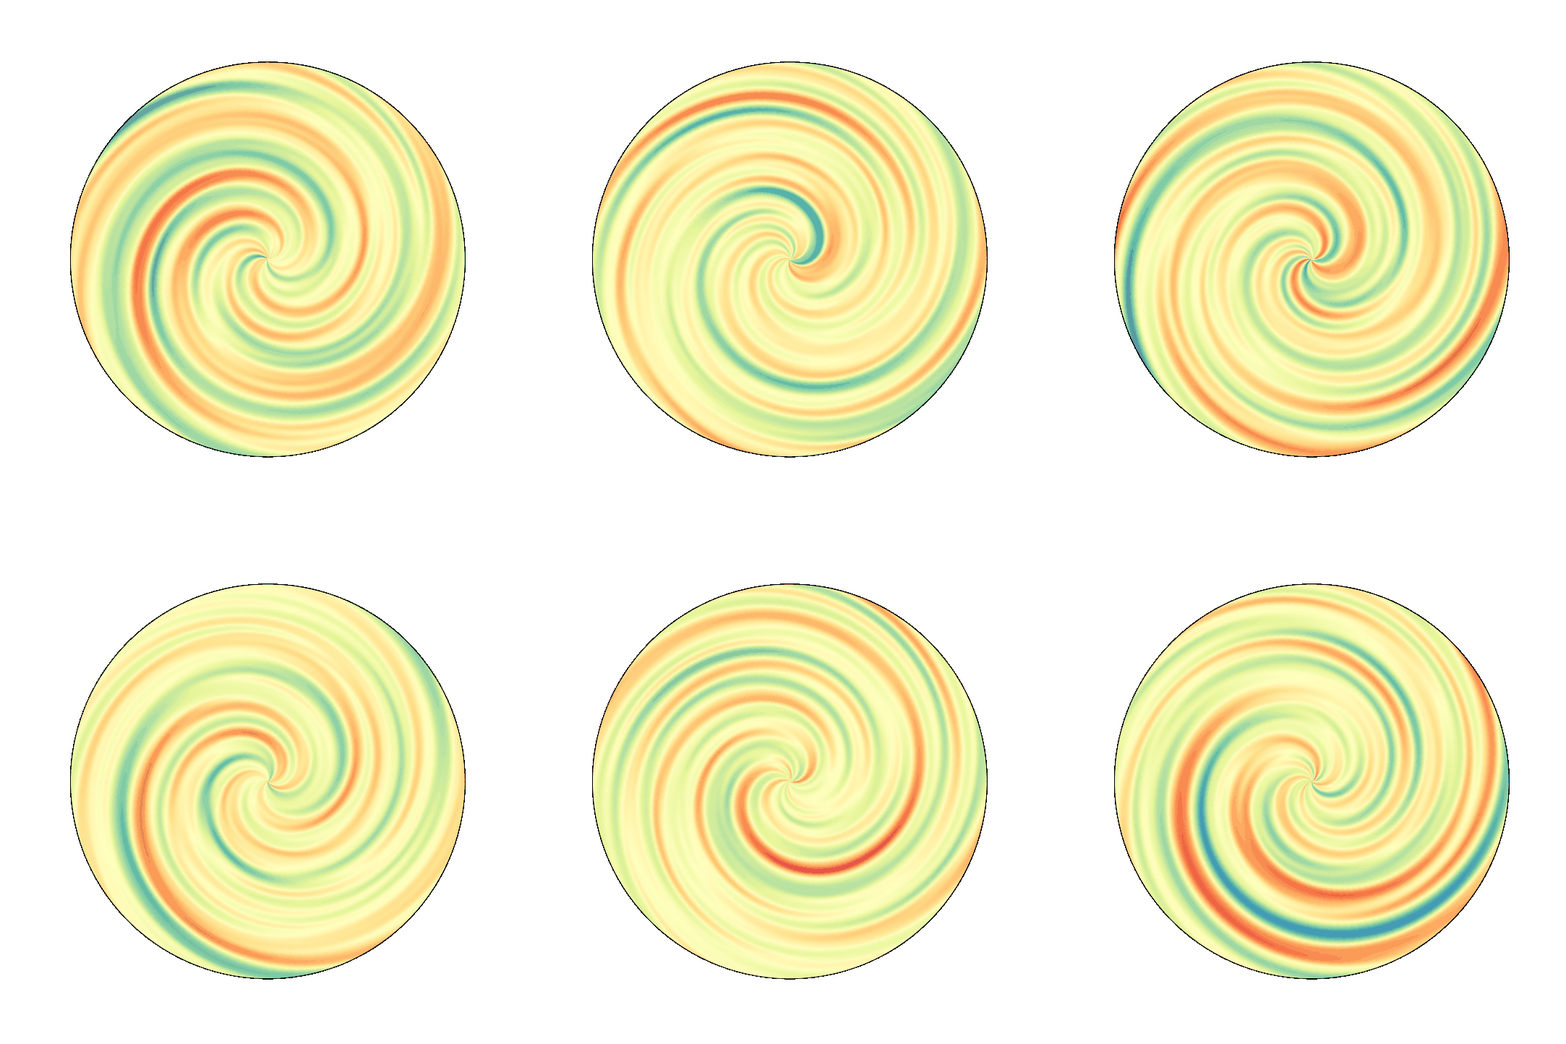
The use of grid_sample can b etedious and here, we show how to use it to create a log-polar transform of the image and create the following figure:

Retinotopy

A picture (extract from the painting "The Ambassadors" by Hans Holbein the Younger can be represented on a regular grid represented by vertical (red) and horizontal (blue) lines. Retinotopy transforms this grid, and in particular the area representing the fovea (shaded gray) is over-represented. Applied to the original image of the portrait, the image is strongly distorted and represents more finally the parts under the axis of sight (here the mouth).

Read more…

Elections présidentielles 2022: estimation du transfert de voix

tl;dr : On essaie ici de deviner le transfert des voix entre les choix effectués entre deux scrutins d'un vote (ici les élections présidentielles 2022 en France) par une méthode d'apprentissage automatique.

DOI

Afin d'analyser les résultats des élections, par exemple les dernières élections présidentielles de 2022 en France, et de mieux comprendre la dynamique des choix de vote entre les différents groupes de population, il peut être utile d'utiliser des outils d'apprentissage automatique pour inférer des structures à première vue cachées dans la masse des données. En particulier, inspiré par cet article du Monde, on peut se poser la question de savoir si on peut extraire depuis les données brutes des élections une estimation du report de voix entre les choix de vote au premier tour et ceux qui sont effectués au deuxième tour.

Pour cela, parmi les outils mathématiques de l'apprentissage automatique, nous allons utiliser des probabilités. Cette théorie va nous permettre d'exprimer le fait que les résultats tels qu'ils sont obtenus peuvent présenter une variabilité mais que celle-ci réelle résulte de préférences de chaque individu dans la population votante. En particulier, on peut considérer que chaque individu va avoir une préférence, graduée entre $0=0\%$ et $1=100\%$ pour chacun des choix (candidats, nul, blanc, abstention) au premier et second tour. Ainsi, les votes effectués vont correspondre à la réalisation de ces préférences.

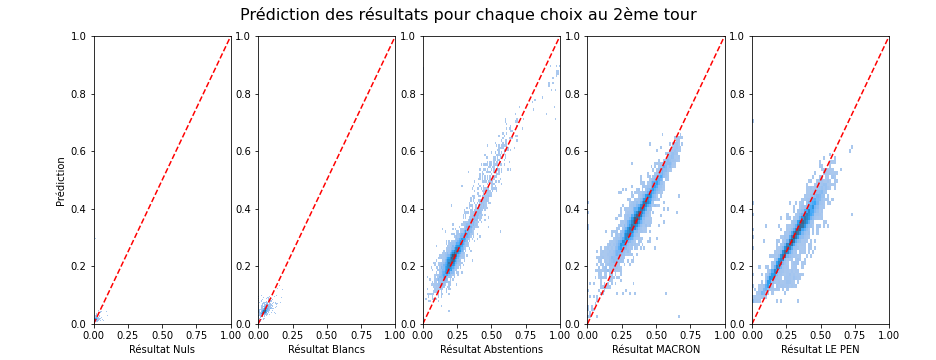
Bien sûr, le vote reste secret et on n'a pas accès au vote de chaque individu et encore moins à ses préférences. Mais comme chaque bureau de vote présente des variabilités liées au contexte local et qui fait que cette population locale a une préférence pour certains choix plutôt que d'autres, on peut considérer chaque bureau de vote comme une population individuelle pour lequel nous allons essayer de prédire les résultats du vote au deuxième tour. En exploitant les irrégularités locales, bureau de vote par bureau de vote, nous allons pouvoir prédire (le mieux possible) le report des votes individuel (de chaque individu tel qu'il passe d'un vote à un autre, par exemple de "Hidalgo" à "Macron"). Nous allons en particulier montrer une prédiction très correcte des données du second tour à partir de ceux du premier, montrant la plausibilité d'une telle hypothèse :
Prédiction du transfert des voix

C'est à ma connaissance une contribution originale (jusqu'à ce qu'une bonne âme veuille bien me donner un lien vers une méthode existante similaire qui me permette de correctement la citer...) que nous allons exploiter ici. Cette prédiction, si elle est efficace (et on va montrer qu'elle est en moyenne correctement prédite avec moins de 2 points de pourcentages d'erreur près), peut donner une idée du transfert de vote entre les deux tours qui a lieu en fonction des préférences des votes de chaque individu.

Nous allons dans la suite montrer comment on peut estimer le pourcentage de chances d'exprimer une voix pour un candidat ou pour l'autre en fonction du choix qu'on a exprimé au premier tour:

Transfert des voix

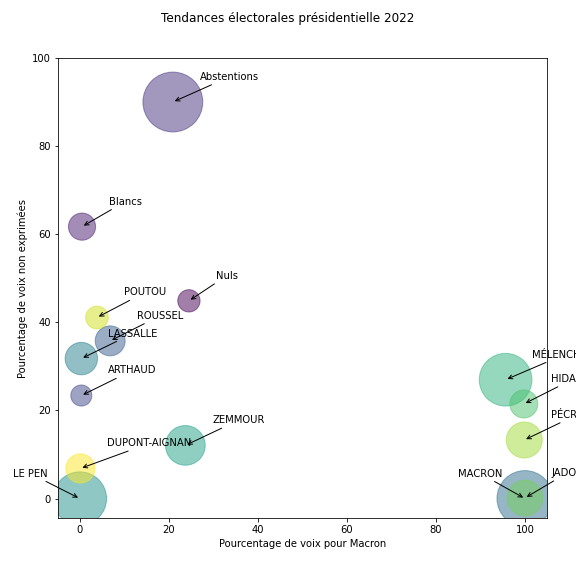
Comme on le verra plus bas, ce tableau montre des tendances claires, par exemple que si on a voté "Macron", "Jadot", "Hidalgo" ou "Pécresse" au premier tour, alors on va certainement voter "Macron" au deuxième tour. Ces électeurs se montrent particulièrement consensuel et suivent le « pacte républicain » mise en place pour faire un "barrage" au Front National (en suivant le terme consacré). Il montre aussi que si on a voté "Le Pen" ou "Dupont-Aignan" au premier tour alors on va voter Le Pen au deuxième, un clair vote de suivi.

Connaissant les couleurs politiques d'autres candidats du premier tour, on peut être surpris que les électeurs de "Arthaud", "Roussel", "Lassalle" ou "Poutou" ont majoritairement choisi "Le Pen" au deuxième tour, signifiant alors un rejet du candidat Macron. Les électeurs de Zemmour sont aussi partagés, signifiant un rejet des deux alternatives. Ce résultat est à prendre avec des pincettes car ces derniers candidats ont obtenu moins de votes et donc que le processus d'inférence est forcément moins précis car il y a moins de données disponibles.

En résumé, cette analyse donne des tendances en fonction des choix exprimés au premier tour: Transfert des voix qui montre une nette séparation des groupes de vote.
Read more…

COSYNE reviewer feedback

tl;dr : Crowd-sourcing raw scores for your COSYNE reviewer feedback.

Following that message:

Dear community,

COSYNE is a great conference which plays a pivotal role in our field. If you have submitted an abstract (or several) you have recently received your scores. I am not affiliated to COSYNE - yet willing to contribute in some way: I would like to ask one minute of your time to report the raw scores from your reviewers. I will summarize in a few lines the results in one week time (11/02). The more numerous your feedbacks the better their precision!

Thanks!

As of 2022-02-20, I had received $N = 98$ answers from the google form (out of them, $95$ are valid) out of the $881$ submitted abstracts. In short, the result is that the total score $S$ is simply the linear sum of the scores $s_i$ given by each reviewer $i$ relatively weighted by the confidence levels $\pi_i$ (as stated in the email we received from the chairs):

$$ S = \frac{ \sum_i \pi_i\cdot s_i}{\sum_i \pi_i} $$

Or if you prefer $$ S = \sum_i \frac{\pi_i}{\sum_j \pi_j} \cdot s_i $$

We deduce from that formula that the threshold is close to $6.34$ this year:

2022-02-11_COSYNE-razor

More details in the notebook (or directly in this post) which can also be forked here and interactively modified on binder.

EDIT: On 2022-02-20, I have updated the notebook to account for new answers, I have now received $N = 98$ answers (out of them, $95$ are valid), yet nothing changed qualitatively. On 2022-02-11, I had received $N = 82$ answers from the google form (out of them, $79$ are valid) and the estimated threshold wass close to $6.05$.

Read more…

Dreamachine

It's at the MIAM (Miam Musée International des Arts Modestes) in Sète, France, that I could for the first time experience really the Dreamachine. It's an optical system which consists of a central light which is periodically occluded by a rotating (cardboard?) cylinder.

The magic of it is that the frequency of occlusion is around $12$ Hz, an important resonant state for sensory system. For the first time, I could really try it out at the MIAM - the important point being to close your lids and rest quiet while looking at the stroboscopic light source. Surprisingly, you see the emergence of "psychedelic patterns" (of course, less than in hippie's movies) yet of the order of the color pattern that may arise in Benham's Disk.

It's difficult to reproduce this pattern on a screen, yet it is still possible to give an impression of it. The goal is here :

  • to generate a complex visual stimulation flickering on average at $12$ Hz

  • to project it on a retinotopic space to maximise the "psychelic" effect

retino_alpha

Read more…

Experimenting with transfer learning for visual categorization

DOI

Hi! I am Jean-Nicolas Jérémie and the goal of this notebook is to provide a framework to implement (and experiment with) transfer learning on deep convolutional neuronal network (DCNN). In a nutshell, transfer learning allows to re-use the knowlegde learned on a problem, such as categorizing images from a large dataset, and apply it to a different (yet related) problem, performing the categorization on a smaller dataset. It is a powerful method as it allows to implement complex task de novo quite rapidly (in a few hours) without having to retrain the millions of parameters of a DCNN (which takes days of computations). The basic hypothesis is that it suffices to re-train the last classification layers (the head) while keeping the first layers fixed. Here, these networks teach us also some interesting insights into how living systems may perform such categorization tasks.

Based on our previous work, we will start from a VGG16 network loaded from the torchvision.models library and pre-trained on the Imagenet dataset wich allows to perform label detection on naturals images for $K = 1000$ labels. Our goal here will be to re-train the last fully-Connected layer of the network to perfom the same task but in a sub-set of $K = 10$ labels from the Imagenet dataset.

Moreover, we are going to evaluate different strategies of transfer learning:

  • VGG General : Substitute the last layer of the pyTorch VGG16 network ($K = 1000$ labels) with a new layer build from a specific subset ($K = 10$ labels).
  • VGG Linear : Add a new layer build from a specific subset ($K = 10$ labels) after the last Fully-Connected layer of the the pyTorch VGG16 network.
  • VGG Gray : Same architecture as the VGG General network but trained with grayscale images.
  • VGG Scale : Same architecture as the VGG General network but trained with images of different size.
  • VGG Full : Same architecture as the VGG General network but all the layers are trained (otherwise I trained the last Fully-Connected layer).

In this notebook, I will use the pyTorch library for running the networks and the pandas library to collect and display the results. This notebook was done during a master 2 internship at the Neurosciences Institute of Timone (INT) under the supervision of Laurent Perrinet. It is curated in the following github repo.

Read more…

Modelling Ocean surface waves

Trying to model Ocean surface waves, I have played using a linear superposition of sinusoids and also on the fact that phase speed (following a wave's crest) is twice as fast as group speed (following a group of waves). Finally, I more recently used such generation of a model of the random superposition of waves to model the wigggling lines formed by the refraction (bendings of the trajectory of a ray at the interface between air and water) of light, called caustics...

Observing real-life ocean waves instructed me that if a single wave is well approximated by a sinusoïd, each wave is qualitatively a bit different. Typical for these surface gravity waves are the sharp crests and flat troughs. As a matter of fact, modelling ocean waves is on one side very useful (Ocean dynamics and its impact on climate, modelling tides, tsunamis, diffraction in a bay to predict coastline evolution, ...) but quite demanding despite a well known mathematical model. Starting with the Navier-Stokes equations to an incompressible fluid (water) in a gravitational field leads to Luke's variational principle in certain simplifying conditions. Further simplifications lead to the approximate solution given by Stokes which gives the following shape as the sum of different harmonics:

Stokes wave(https://en.wikipedia.org/wiki/Stokes_wave)

This seems well enough at the moment and I will capture this shape in this notebook and notably if that applies to a random mixture of such waves...

(WORK IN PROGRESS)

The current situation is that these solutions seem to not fit what is displayed on the wikipedia page and that I do not spot the bug I may have introduced... More work on this is needed and any feedback is welcome...

Read more…

Density of stars on the surface of the sky

DOI

Looking at the night sky, the pattern of stars on the surface of the sky follows a familiar pattern. The Big Dipper, Cassiopeia, the Pleiades, or Orion are popular landmarks in the sky which we can immediatly recognize.

Different civilisations labelled these patterns using names such as constellations in the western world. However, this pattern is often the result of pure chance. Stars from one constellation belong often to remote areas in the universe and they bear this familiarity only because we always saw them as such; the rate at which stars move is much shorter than the lifespan of humanity.

I am curious here to study the density of stars as they appear on the surface of the sky. It is both a simple question yet a complex to formulate. Is there any generic principle that could be used to characterize their distribution? This is my attempt to answer the question

https://astronomy.stackexchange.com/questions/43147/density-of-stars-on-the-surface-of-the-sky

(but also to make the formulation of the question clearer...). This is my answer:

Read more…

Fitting COVID data

I propose here a simple method to fit experimental data common to epidemiological spreads, such as the present COVID-19 pandemic, using the inverse gaussian distribution. This follows the general incompregension of my answer to the question Is the COVID-19 pandemic curve a Gaussian curve? on StackOverflow. My initial point is to say that a Gaussian is not adapted as it handles a distribution on real numbers, while such a curve (the variable being number of days) handles numbers on the half line. Inspired by the excellent A Theory of Reaction Time Distributions by Dr Fermin Moscoso del Prado Martin a constructive approach is to propose another distribution, such as the inverse Gaussian distribution.

This notebook develops this same idea on real data and proves numerically how bad the Gaussian fit is compared to the latter. Thinking about the importance of doing a proper inference in such a case, I conclude

Read more…

Benchmarking CNNs

Hi! I am Jean-Nicolas Jérémie and the goal of this benchmark is to offer a comparison between differents pre-trained image recognition's networks based on the Imagenet dataset wich allows to work on naturals images for $1000$ labels. These different networks tested here are taken from the torchvision.models library : AlexNet, VGG16, MobileNetV2 and ResNet101.

Our use case is to measure the performance of a system which receives a sequence of images and has to make a decision as soon as possible, hence with batch_size=1. Specifically, we wish also to compare different computing architectures such as CPUs, desktop GPUs or other more exotic platform such as the Jetson TX2 (experiment 1). Additionally, we will implement some image transformations as up/down-sampling (experiment 2) or transforming to grayscale (experiment 3) to quantify their influence on the accuracy and computation time of each network.

In this notebook, I will use the Pytorch library for running the networks and the pandas library to collect and display the results. This notebook was done during a master 1 internship at the Neurosciences Institute of Timone (INT) under the supervision of Laurent PERRINET. It is curated in the following github repo.

Read more…

nesting jupyter runs

Jupyter notebooks are a great way of sharing knowledge in science, art, programming. For instance, in a recent musing, I tried to programmatically determine the color of the sky. This renders as a web page, but is also a piece of runnable code.

As such, they are also great ways to store the knowledge that was acquired at a given time and that could be reusable. This may be considered as bad programming and may have downsides as described in that slides :

Joel Grus

Recently, thanks to an answer to a stack overflow question, I found a way to overcome this by detecting if the caall to a notebook is made from the notebook itself or from a parent.

Read more…

Colors of the sky

Our sensorial environment contains multiple regularities which our brain uses to optimize its representation of the world: objects fall most of the time downwards, the nose is usually in the middle below the eyes, the sky is blue... Concerning this last point, I wish here to illustrate the physical origins of this phenomenon and in particular the range of colors that you may observe in the sky.

Read more…

Caustic (optics)

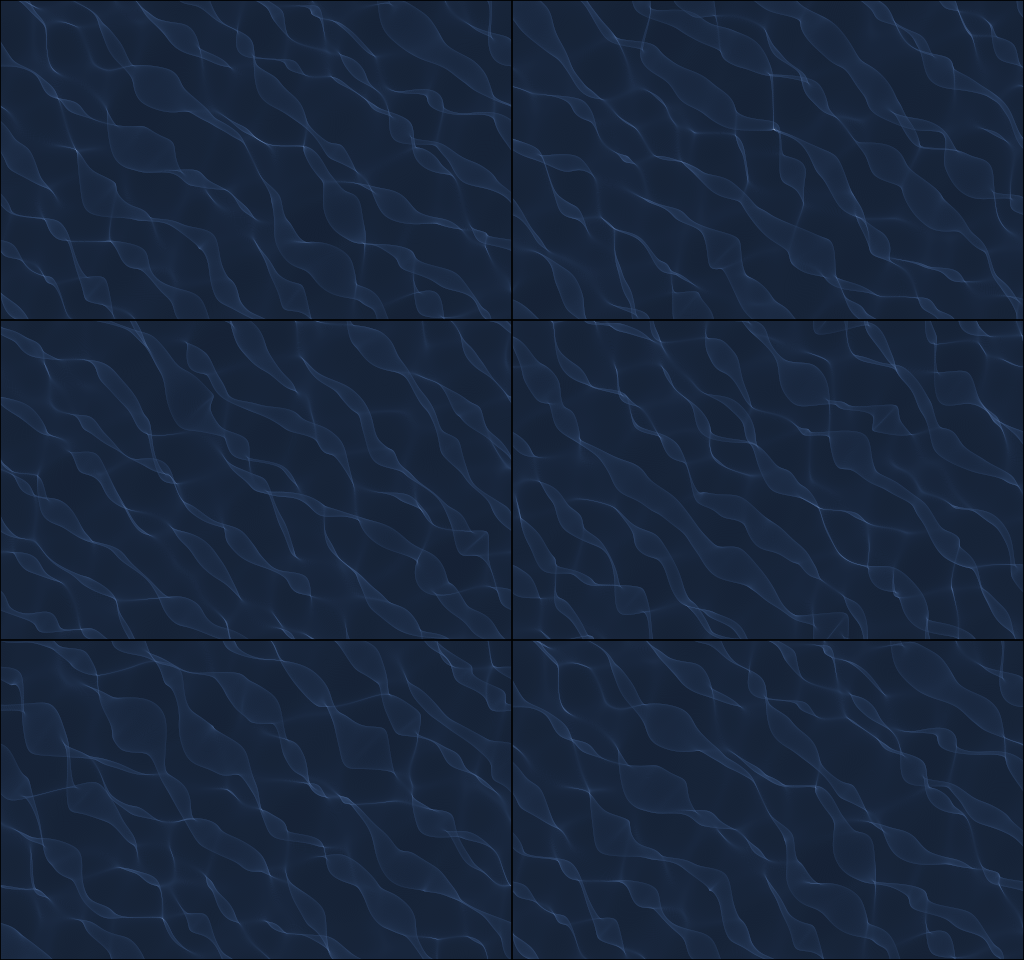
Caustics (wikipedia are luminous patterns which are resulting from the superposition of smoothly deviated light rays. It is for instance the heart-shaped pattern in your cup of coffee which is formed as the rays of the sun are reflected on the cup's surface. It is also the wiggly pattern of light curves that you will see on the floor of a pool as the sun's light is refracted at the surface of the water. Here, we simulate that particular physical phenomenon. Simply because they are mesmerizingly beautiful, but also as it is of interest in visual neuroscience. Indeed, it speaks to how images are formed (more on this later), hence how the brain may understand images.

In this post, I will develop a simple formalism to generate such patterns, with the paradoxical result that it is very simple to code yet generates patterns with great complexity, such as:


No description has been provided for this image

This is joint work with artist Etienne Rey, in which I especially follow the ideas put forward in the series Turbulence.

DOI

Fitting a psychometric curve using pyTorch

The goal here is to compare methods which fit data with psychometric curves using logistic regression. Indeed, after (long) experiments where for instance you collected sequences of keypresses, it is important to infer at best the parameters of the underlying processes: was the observer biased, or more precise?

While I was forevever using sklearn or lmfit (that is, scipy's minimize) and praised these beautifully crafted methods, I sometimes lacked some flexibility in the definition of the model. This notebook was done in collaboration with Jenna Fradin, master student in the lab.

tl; dr = Do not trust the coefficients extracted by a fit without validating for methodological biases.

One part of flexibility I missed is taking care of the lapse rate, that is the frequency with which you just miss the key. In a psychology experiment, you often see a fast sequence of trials for which you have to make a perceptual deccision, for instance press the Left or Right arrows. Sometimes you know the answer you should have done, but press the wrong eror. This error of distraction is always low (in the order of 5% to 10%) but could potentially change the results of the experiments. This is one of the aspects we will evaluate here.

In this notebook, I define a fitting method using pytorch which fits in a few lines of code :

In [1]:
import torch
from torch.utils.data import TensorDataset, DataLoader

torch.set_default_tensor_type("torch.DoubleTensor")
criterion = torch.nn.BCELoss(reduction="sum")

class LogisticRegressionModel(torch.nn.Module):
    def __init__(self, bias=True, logit0=-2, theta0=0, log_wt=torch.log(0.1*torch.ones(1))):
        super(LogisticRegressionModel, self).__init__()
        #self.linear = torch.nn.Linear(1, 1, bias=bias)
        self.theta0 = torch.nn.Parameter(theta0 * torch.ones(1))
        self.logit0 = torch.nn.Parameter(logit0 * torch.ones(1))
        self.log_wt = torch.nn.Parameter(log_wt * torch.ones(1))

    def forward(self, theta):
        p0 = torch.sigmoid(self.logit0)
        #out = p0 / 2 + (1 - p0) * torch.sigmoid(self.linear(theta))
        out = p0 / 2 + (1 - p0) * torch.sigmoid((theta-self.theta0 )/torch.exp(self.log_wt))
        return out

learning_rate = 0.005
beta1, beta2 = 0.9, 0.999
betas = (beta1, beta2)
num_epochs = 2 ** 9 + 1
batch_size = 256
amsgrad = False # gives similar results
amsgrad = True  # gives similar results

def fit_data(
    theta,
    y,
    learning_rate=learning_rate,
    batch_size=batch_size,  # gamma=gamma,
    num_epochs=num_epochs,
    betas=betas,
    verbose=False, **kwargs
):

    Theta, labels = torch.Tensor(theta[:, None]), torch.Tensor(y[:, None])
    loader = DataLoader(
        TensorDataset(Theta, labels), batch_size=batch_size, shuffle=True
    )

    device = torch.device("cuda" if torch.cuda.is_available() else "cpu")

    logistic_model = LogisticRegressionModel()
    logistic_model = logistic_model.to(device)
    logistic_model.train()
    optimizer = torch.optim.Adam(
        logistic_model.parameters(), lr=learning_rate, betas=betas, amsgrad=amsgrad
    )
    for epoch in range(int(num_epochs)):
        logistic_model.train()
        losses = []
        for Theta_, labels_ in loader:
            Theta_, labels_ = Theta_.to(device), labels_.to(device)
            outputs = logistic_model(Theta_)
            loss = criterion(outputs, labels_)

            optimizer.zero_grad()
            loss.backward()
            optimizer.step()
            losses.append(loss.item())

        if verbose and (epoch % (num_epochs // 32) == 0):
            print(f"Iteration: {epoch} - Loss: {np.sum(losses)/len(theta):.5f}")

    logistic_model.eval()
    Theta, labels = torch.Tensor(theta[:, None]), torch.Tensor(y[:, None])
    outputs = logistic_model(Theta)
    loss = criterion(outputs, labels).item() / len(theta)
    return logistic_model, loss

and run a series of tests to compare both methods.

Read more…

Role of gamma correction in Sparse coding

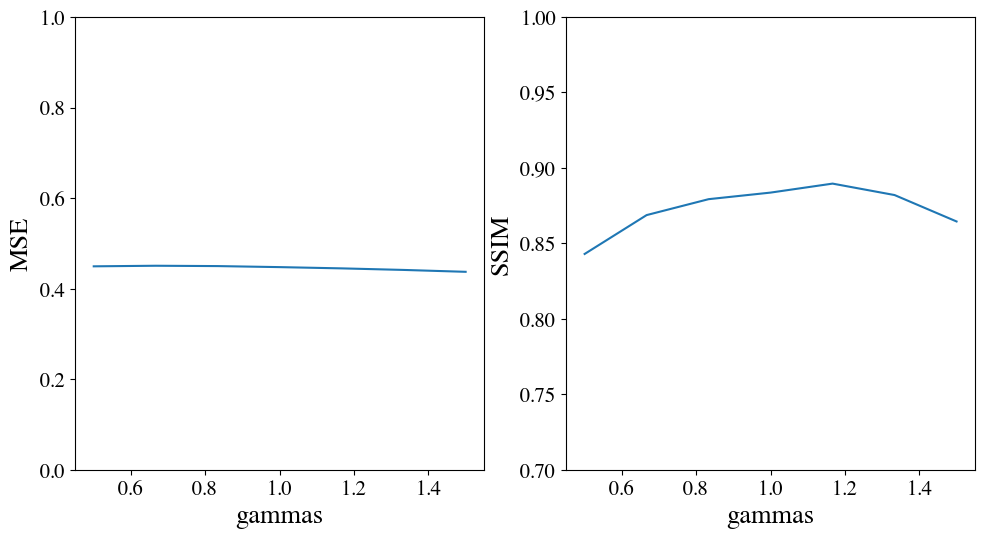
I have previously shown a python implementation which allows for the extraction a sparse set of edges from an image. We were using the raw luminance as the input to the algorithm. What happens if you use gamma correction?

albert on gamma

  • Results : for this particular image, we checked that using the luminance ($\gamma \approx 1$) is the correct choice. The outcome is that gamma correction may improve coding, but only slightly. In the figure below, we plot as a function of gamma the final energy of the error and the perceptually relevant measure of structural simailarity :

albert on gamma

@inbook{Perrinet15bicv,
    title = {Sparse models},
    author = {Perrinet, Laurent U.},
    booktitle = {Biologically-inspired Computer Vision},
    chapter = {13},
    editor = {Keil, Matthias and Crist\'{o}bal, Gabriel and Perrinet, Laurent U.},
    publisher = {Wiley, New-York},
    year = {2015}
}

Read more…

Sparse coding of large images

In this post we would try to show how one could infer the sparse representation of an image knowing an appropriate generative model for its synthesis. We will start by a linear inversion (pseudo-inverse deconvolution), and then move to a gradient descent algorithm. Finally, we will implement a convolutional version of the iterative shrinkage thresholding algorithm (ISTA) and its fast version, the FISTA.

For computational efficiency, all convolutions will be implemented by a Fast Fourier Tansform, so that a standard convolution will be mathematically exactly similar. We will benchmark this on a realistic image size of $512 \times 512$ giving some timing results on a standard laptop.

Read more…

Feature vs global motion

As we see a visual scene, there is contribution of the motion of each of the objects that constitute the visual scene into detecting its global motion. In particular, it is debatable to know which weight individual features, such as small objects in the foreground, have into this computation compared to a dense texture-like stimulus, as that of the background for instance.

Here, we design a a stimulus where we control independently these two aspects of motions to titrate their relative contribution to the detection of motion.

Can you spot the motion ? Is it more going to the upper left or to the upper right?

(For a more controlled test, imagine you fixate on the center of the movie.)

Read more…

Embedding a trajectory in noise

Motion detection has many functions, one of which is the potential localization of the biomimetic camouflage seen in this video. Can we test this in the lab by using synthetic textures such as MotionClouds?

However, by construction, MotionClouds have no spatial structure and it seems interesting to consider more complex trajectories. Following a previous post, we design a trajectory embedded in noise.

Can you spot the motion ? from left to right or reversed ?

(For a more controlled test, imagine you fixate on the top left corner of each movie.)

(Upper row is coherent, lower row uncoherent / Left is -> Right column is <-)

Read more…

Rainbow effect

When I see a rainbow, I perceive the luminance inside the arc to be brighter than outside the arc. Is this effect percpetual (inside our head) or physical (inside each droplet in the sky). So, this is a simple notebook to show off how to synthesize the image of a rainbow on a realistic sky. TL;DR: there must be a physical reason for it.

Outline: The rainbow is a set of colors over a gradient of hues, masked for certain ones. The sky will be a gradient over blueish colors.

Read more…

Statistics of the natural input to a ring model

What does the input to a population of neurons in the primary visual cortex look like? In this post, we will try to have a feeling of the structure and statistics of the natural input to such a "ring" model.

This notebook explores this question using a retina-like temporal filtering and oriented Gabor-like filters. It produces this polar plot of the instantaneous energy in the different orientations for a natural movie :


One observes different striking features in the structure of this input to populations of V1 neurons:

  • input is sparse: often, a few orientations dominate - the shape of these components (bandwidth) seem to be similar,
  • there are many "switches": at some moments, the representations flips to another. This is due to cuts in the movie (changes from one scene to the other for instance). In a more realistic setting where we would add eye movements, these switches should also happen during saccades (but is there any knowledge of the occurence of the switch by the visual system?),
  • between switches, there is some coherence in amplitude (a component will slowly change its energy) but also in time (a component is more likely to have a ghradually changing oriantation, for instance when the scene rotates).

This structure is specific to the structure of natural images and to the way they transform (translations, rotations, zooms due to the motion and deformation of visual objects). This is certainly incorporated as a "prior" information in the structure of the visual cortex. As to know how and where this is implemented is an open scientific question.

This is joint work with Hugo Ladret.

Read more…

Extending datasets in pyTorch

PyTorch is a great library for machine learning. You can in a few lines of codes retrieve a dataset, define your model, add a cost function and then train your model. It's quite magic to copy and paste code from the internet and get the LeNet network working in a few seconds to achieve more than 98% accuracy.

However, it can be tedious sometimes to extend existing objects and here, I will manipulate some ways to define the right dataset for your application. In particular I will modify the call to a standard dataset (MNIST) to place the characters at random places in a large image.

Read more…

Predictive coding of variable motion

In some recent modeling work:

Laurent Perrinet, Guillaume S. Masson. Motion-based prediction is sufficient to solve the aperture problem. Neural Computation, 24(10):2726--50, 2012 https://laurentperrinet.github.io/publication/perrinet-12-pred

we study the role of transport in modifying our perception of motion. Here, we test what happens when we change the amount of noise in the stimulus.

In this script the predictive coding is done using the MotionParticles package and for a motion texture within a disk aperture.

Read more…

accessing the data from a pupil recording

I am experimenting with the pupil eyetracker and could set it up (almost) smoothly on a macOS. There is an excellent documentation, and my first goal was to just record raw data and extract eye position.

In [1]:
from IPython.display import HTML
HTML('<center><video controls autoplay loop src="https://laurentperrinet.github.io/sciblog/files/2017-12-13_pupil%20test_480.mp4" width=61.8%/></center>')
Out[1]:

This video shows the world view (cranio-centric, from a head-mounted camera fixed on the frame) with overlaid the position of the (right) eye while I am configuring a text box. You see the eye fixating on the screen then jumping somewhere else on the screen (saccades) or on the keyboard / hands. Note that the screen itself shows the world view, such that this generates an self-reccurrent pattern.

For this, I could use the capture script and I will demonstrate here how to extract the raw data in a few lines of python code.

Read more…

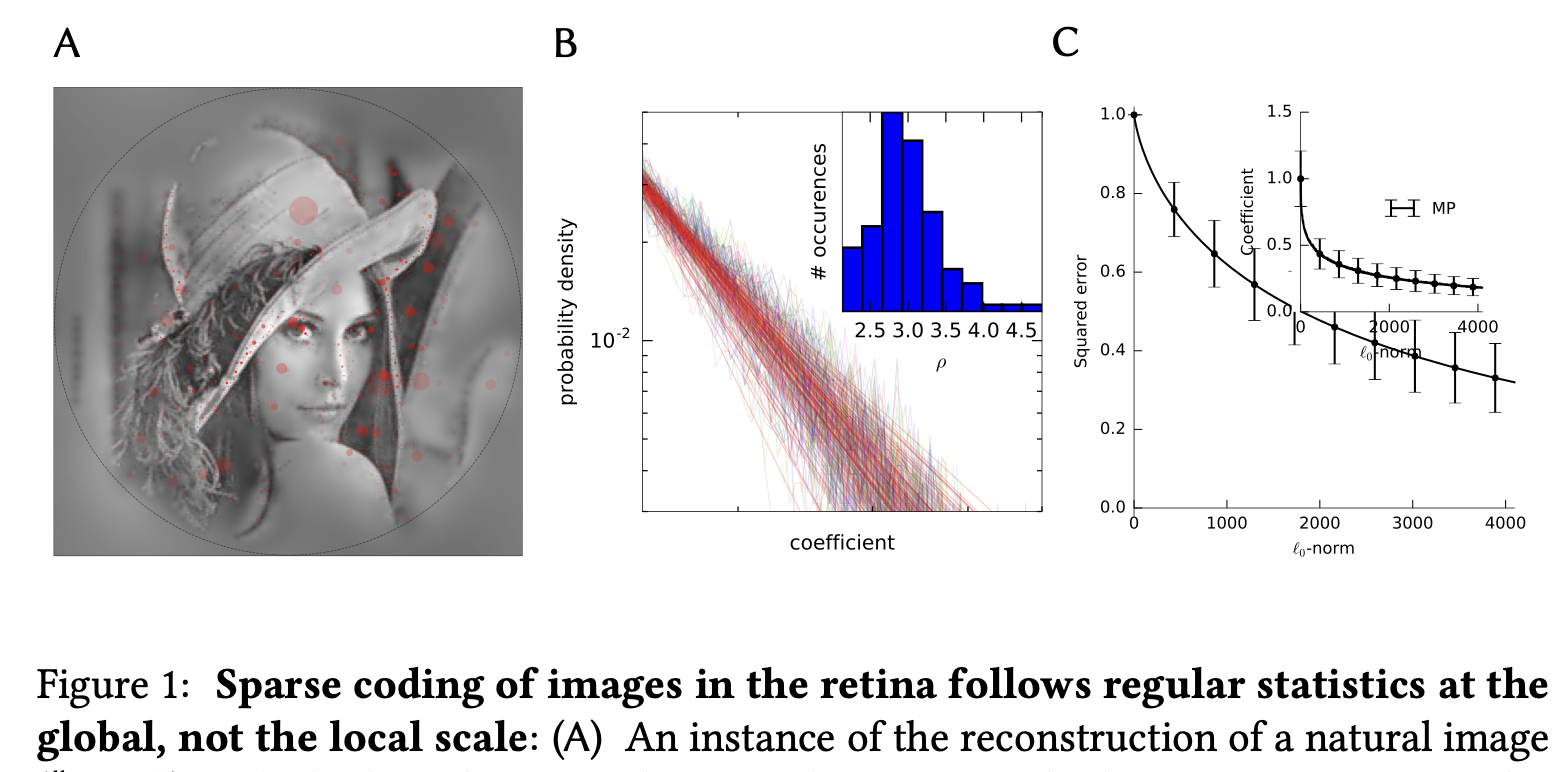
Computing sparseness of natural images with retina-like RFs

In [1]:
%load_ext autoreload
%autoreload 2

SparseEdges : computing sparseness of natural images with retina-like RFs

Natural images follow statistics inherited by the structure of our physical (visual) environment. In particular, a prominent facet of this structure is that images can be described by a relatively sparse number of features. To investigate the role of this sparseness in the efficiency of the neural code, we designed a new class of random textured stimuli with a controlled sparseness value inspired by measurements of natural images. Then, we tested the impact of this sparseness parameter on the firing pattern observed in a population of retinal ganglion cells recorded ex vivo in the retina of a rodent, the Octodon degus. These recordings showed in particular that the reliability of spike timings varies with respect to the sparseness with globally a similar trend than the distribution of sparseness statistics observed in natural images. These results suggest that the code represented in the spike pattern of ganglion cells may adapt to this aspect of the statistics of natural images.

statistics of natural images

Read more…

MEUL with a non-parametric homeostasis

In this notebook, we will study how homeostasis (cooperation) may be an essential ingredient to this algorithm working on a winner-take-all basis (competition). This extension has been published as Perrinet, Neural Computation (2010) (see https://laurentperrinet.github.io/publication/perrinet-10-shl ). Compared to other posts, such as this previous post, we improve the code to not depend on any parameter (namely the Cparameter of the rescaling function). For that, we will use a non-parametric approach based on the use of cumulative histograms.

This is joint work with Victor Boutin and Angelo Francisioni. See also the other posts on unsupervised learning.

Read more…

Designing a A0 poster using matplotlib

Poster GDR Vision

This poster was presented in Lille at a vision workshop, check out https://laurentperrinet.github.io/publication/perrinet-17-gdr

Apart the content (which is in French) which recaps some previous work inbetween art and science, this post demonstrates how to generate a A0 poster programmatically. In particular, we will use matplotlib and some quickly forged functions to ease up the formatting.

Read more…

Improving calls to the LogGabor library

To code image as edges, for instance in the SparseEdges sparse coding scheme, we use a model of edges in images. A good model for these edges are bidimensional Log Gabor filter. This is implemented for instance in the LogGabor library. The library was designed to be precise, but not particularly for efficiency. In order to improve its speed, we demonstrate here the use of a cache to avoid redundant computations.

Read more…

The fastest 2D convolution in the world

Convolutions are essential components of any neural networks, image processing, computer vision ... but these are also a bottleneck in terms of computations... I will here benchmark different solutions using numpy, scipy or pytorch. This is work-in-progress, so that any suggestion is welcome, for instance on StackExchange or in the comments below this post.

Read more…

Le jeu de l'urne

Lors de la visite au laboratoire d'une brillante élève de seconde (salut Lena!), nous avons inventé ensemble un jeu: le jeu de l'urne. Le principe est simple: il faut deviner la couleur de la balle qu'on tire d'une urne contenant autant de balles rouges que noires - et ceci le plus tôt possible. Plus précisément, les règles sont:

  • On a un ensemble de balles, la motié sont rouges, l'autre moitié noires (c'est donc un nombre pair de balles qu'on appelera $N$, disons $N=8$).
  • Elles sont dans une urne opaque et donc on ne peut pas les voir à moins de les tirer une par une (sans remise dans l'urne). On peut tirer autant de balles qu'on veut pour les observer.
  • Le but est de deviner la balle qu'on va tirer. Si on gagne (on a bien prédit la couleur), alors on gagne autant de points que le nombre de balles qui étaient dans l'urne au moment de la décision. Sinon on perd autant de points que l'on en aurait gagné!
  • à long terme, la stratégie du jeu est de décider le meilleur moment où on est prêt à deviner la couleur de la balle qu'on va prendre et ainsi de gagner le plus de points possibles.

Nous avons d'abord créé ce jeu grâce au language de programmation Scratch sur https://scratch.mit.edu/projects/165806365/:

Ici, nous allons essayer de l'analyser plus finement.

Read more…

testing COMPs-fastPcum_scripted

In this notebook, we will study how homeostasis (cooperation) may be an essential ingredient to this algorithm working on a winner-take-all basis (competition). This extension has been published as Perrinet, Neural Computation (2010) (see https://laurentperrinet.github.io/publication/perrinet-10-shl ). Compared to the previous post, we integrated the faster code to https://github.com/bicv/SHL_scripts.

See also the other posts on unsupervised learning,

This is joint work with Victor Boutin.

Read more…

testing COMPs-fastPcum

In this notebook, we will study how homeostasis (cooperation) may be an essential ingredient to this algorithm working on a winner-take-all basis (competition). This extension has been published as Perrinet, Neural Computation (2010) (see https://laurentperrinet.github.io/publication/perrinet-10-shl ). Compared to the previous post, we optimize the code to be faster.

See also the other posts on unsupervised learning,

This is joint work with Victor Boutin.

Read more…

testing COMPs-Pcum

In this notebook, we will study how homeostasis (cooperation) may be an essential ingredient to this algorithm working on a winner-take-all basis (competition). This extension has been published as Perrinet, Neural Computation (2010) (see https://laurentperrinet.github.io/publication/perrinet-10-shl ). In particular, we will show how one can build the non-linear functions based on the activity of each filter and which implement homeostasis.

See also the other posts on unsupervised learning,

This is joint work with Victor Boutin.

Read more…

A change in the definition of spatial frequency bandwidth?

Since the beginning, we have used a definition of bandwidth in the spatial frequency domain which was quite standard (see supp material for instance):

$$ \mathcal{E}(f; sf_0, B_{sf}) \propto \frac {1}{f} \cdot \exp \left( -.5 \frac {\log( \frac{f}{sf_0} ) ^2} {\log( 1 + \frac {B_sf}{sf_0} )^2 } \right) $$

This is implemented in the folowing code which reads:

env = 1./f_radius*np.exp(-.5*(np.log(f_radius/sf_0)**2)/(np.log((sf_0+B_sf)/sf_0)**2))

However the one implemented in the code looks different (thanks to Kiana for spotting this!), so that one can think that the code is using:

$$ \mathcal{E}(f; sf_0, B_{sf}) \propto \frac {1}{f} \cdot \exp \left( -.5 \frac {\log( \frac{f}{sf_0} ) ^2} {\log(( 1 + \frac {B_sf}{sf_0} )^2 ) } \right) $$

The difference is minimal, yet very important for a correct definition of the bandwidth!

Read more…

Manipulating speed in motion clouds

An essential dimension of motion is speed. However, this notion is prone to confusions as the speed that has to be measured can be relative to different object. Is it the speed of pixels? The speed of visual objects? We try to distinguish the latter two in this post.

In [4]:
from IPython.display import Image
Image('http://www.rhsmpsychology.com/images/monocular_IV.jpg')
Out[4]:
No description has been provided for this image

Extending Olshausens classical SparseNet

  • In a previous notebook, we tried to reproduce the learning strategy specified in the framework of the SparseNet algorithm from Bruno Olshausen. It allows to efficiently code natural image patches by constraining the code to be sparse. In particular, we saw that in order to optimize competition, it is important to control cooperation and we implemented a heuristic to just do this.

  • In this notebook, we provide an extension to the SparseNet algorithm. We will study how homeostasis (cooperation) may be an essential ingredient to this algorithm working on a winner-take-all basis (competition). This extension has been published as Perrinet, Neural Computation (2010) (see https://laurentperrinet.github.io/publication/perrinet-10-shl ):

@article{Perrinet10shl,
    Title = {Role of homeostasis in learning sparse representations},
    Author = {Perrinet, Laurent U.},
    Journal = {Neural Computation},
    Year = {2010},
    Doi = {10.1162/neco.2010.05-08-795},
    Keywords = {Neural population coding, Unsupervised learning, Statistics of natural images, Simple cell receptive fields, Sparse Hebbian Learning, Adaptive Matching Pursuit, Cooperative Homeostasis, Competition-Optimized Matching Pursuit},
    Month = {July},
    Number = {7},
    Url = {https://laurentperrinet.github.io/publication/perrinet-10-shl},
    Volume = {22},
}

This is joint work with Victor Boutin.

Read more…

Reproducing Olshausen's classical SparseNet (part 3)

In this notebook, we test the convergence of SparseNet as a function of different learning parameters. This shows the relative robustness of this method according to the coding parameters, but also the importance of homeostasis to obtain an efficient set of filters:

  • first, whatever the learning rate, the convergence is not complete without homeostasis,
  • second, we achieve better convergence for similar learning rates and on a certain range of learning rates for the homeostasis
  • third, the smoothing parameter alpha_homeo has to be properly set to achieve a good convergence.
  • last, this homeostatic rule works with the different variants of sparse coding.

See also :

This is joint work with Victor Boutin.

Read more…

Reproducing Olshausens classical SparseNet (part 2)

  • In a previous notebook, we tried to reproduce the learning strategy specified in the framework of the SparseNet algorithm from Bruno Olshausen. It allows to efficiently code natural image patches by constraining the code to be sparse.

  • However, the dictionaries are qualitatively not the same as the one from the original paper, and this is certainly due to the lack of control in the competition during the learning phase.

  • Herein, we re-implement the cooperation mechanism in the dictionary learning routine - this will be then proposed to the main code.

This is joint work with Victor Boutin.

Read more…

Reproducing Olshausen's classical SparseNet (part 1)

  • This notebook tries to reproduce the learning strategy specified in the framework of the SparseNet algorithm from Bruno Olshausen. It allows to efficiently code natural image patches by constraining the code to be sparse.

  • the underlying machinery uses a similar dictionary learning as used in the image denoising example from sklearn and our aim here is to show that a novel ingredient is necessary to reproduce Olshausen's results.

  • All these code bits is regrouped in the SHL scripts repository (where you will also find some older matlab code). You may install it using

    pip install git+https://github.com/bicv/SHL_scripts

  • following this failed PR to sklearn that was argued in this post (and following) the goal of this notebooks is to illustrate the simpler code implemented in the SHL scripts

This is joint work with Victor Boutin.

Read more…

Bogacz (2017) A tutorial on free-energy

I enjoyed reading "A tutorial on the free-energy framework for modelling perception and learning" by Rafal Bogacz, which is freely available here. In particular, the author encourages to replicate the results in the paper. He is himself giving solutions in matlab, so I had to do the same in python all within a notebook...

Read more…

Resizing a bunch of files using the command-line interface

generating databases

A set of bash code to resize images to a fixed size.

Problem statement: we have a set of images with heterogeneous sizes and we want to homogenize the database to avoid problems when classifying them. Solution: ImageMagick.

We first identify the size and type of images in the database. The database is a collection of folders containing each a collection of files. We thus do a nested recursive loop:

Read more…

Finding extremal values in a nd-array

Sometimes, you need to pick up the $N$-th extremal values in a mutli-dimensional matrix.

Let's suppose it is represented as a nd-array (here, I further suppose you are using the numpy library from the python language). Finding extremal values is easy with argmax, argmin or argsort but this function operated on 1d vectors... Juggling around indices is sometimes not such an easy task, but luckily, we have the unravel_index function.

For those in a hurry, one quick application is that given an np.ndarray, it's eeasy to get the index of the maximal value in that array :

In [1]:
import numpy as np
x = np.arange(2*3*4).reshape((4, 3, 2))
x = np.random.permutation(np.arange(2*3*4)).reshape((4, 3, 2))
print ('input ndarray', x)
idx = np.unravel_index(np.argmax(x.ravel()), x.shape)
print ('index of maximal value = ', idx, ' and we verify that ', x[idx], '=', x.max())
input ndarray [[[ 4  3]
  [19  7]
  [ 1 13]]

 [[ 6 12]
  [14  0]
  [16 11]]

 [[15 17]
  [20 22]
  [ 9  5]]

 [[ 8 18]
  [23 21]
  [10  2]]]
index of maximal value =  (3, 1, 0)  and we verify that  23 = 23

Let's unwrap how we found such an easy solution...

Read more…

Saving and displaying movies and dynamic figures

It is insanely useful to create movies to illustrate a talk, blog post or just to include in a notebook:

In [1]:
from IPython.display import HTML
HTML('<center><video controls autoplay loop src="../files/2016-11-15_noise.mp4" width=61.8%/></center>')
Out[1]:

For years I have used a custom made solution made around saving single frames and then calling ffmpeg to save that files to a movie file. That function (called anim_save had to be maintained accross different libraries to reflect new needs (going to WEBM and MP4 formats for instance). That made the code longer than necessary and had not its place in a scientific library.

Here, I show how to use the animation library from matplotlib to replace that

Read more…

A pi-pie named Monte Carlo

A lively community of people including students, researchers and tinkerers from Marseille (France) celebrate the so-called "π-day" on the 3rd month, 14th day of each year. A nice occasion for general talks on mathematics and society in a lively athmosphere and of course to ... a pie contest!

I participated last year (in 2016) with a pie called "Monte Carlo". Herein, I give the recipe by giving some clues on its design... This page is a notebook - meaning that you can download it and re-run the analysis I do here at home (and most importantly comment or modify it and correct potential bugs...).

Read more…

Une tarte au pi nommée Monte Carlo

Une active communauté d'étudiants, chercheurs et bidouilleurs célèbrent à Marseille la "journée π" le 3ème mois, 14ème jour de chaque année. Une occasion de rêve pour en apprendre plus sur les mathématiques et la science dans une ambiance conviviale... Mais c'est aussi l'occasion d'un concours de tartes!

J'ai eu l'opportunité d'y participer l'an dernier (soit pour l'édition 2016) avec une tarte appelée "Monte Carlo". Je vais donner ici la "recette" de ma tarte, le lien avec le nombre π et quelques digressions mathématiques (notament par rapport à la présence incongrue d'un éléphant mais aussi par rapport à la démarche scientifique)... Cette page est un "notebook" - vous pouvez donc la télécharger et relancer les analyses et figures (en utilisant python + jupyter). C'est aussi un travail non figé - prière de me suggérer des corrections!

Read more…

Predictive coding of motion in an aperture

After reading the paper Motion Direction Biases and Decoding in Human Visual Cortex by Helena X. Wang, Elisha P. Merriam, Jeremy Freeman, and David J. Heeger (The Journal of Neuroscience, 10 September 2014, 34(37): 12601-12615; doi: 10.1523/JNEUROSCI.1034-14.2014), I was interested to test the hypothesis they raise in the discussion section :

The aperture-inward bias in V1–V3 may reflect spatial interactions between visual motion signals along the path of motion (Raemaekers et al., 2009; Schellekens et al., 2013). Neural responses might have been suppressed when the stimulus could be predicted from the responses of neighboring neurons nearer the location of motion origin, a form of predictive coding (Rao and Ballard, 1999; Lee and Mumford, 2003). Under this hypothesis, spatial interactions between neurons depend on both stimulus motion direction and the neuron's relative RF locations, but the neurons themselves need not be direction selective. Perhaps consistent with this hypothesis, psychophysical sensitivity is enhanced at locations further along the path of motion than at motion origin (van Doorn and Koenderink, 1984; Verghese et al., 1999).

Concerning the origins of aperture-inward bias, I want to test an alternative possibility. In some recent modeling work:

Laurent Perrinet, Guillaume S. Masson. Motion-based prediction is sufficient to solve the aperture problem. Neural Computation, 24(10):2726--50, 2012 https://laurentperrinet.github.io/publication/perrinet-12-pred

I was surprised to observe a similar behavior: the trailing edge was exhibiting a stronger activation (i. e. higher precision revealed by a lower variance in this probabilistic model) while I would have thought intuitively the leading edge would be more informative. In retrospect, it made sense in a motion-based prediction algorithm as information from the leading edge may propagate in more directions (135° for a 45° bar) than in the trailing edge (45°, that is a factor of 3 here). While we made this prediction we did not have any evidence for it.

In this script the predictive coding is done using the MotionParticles package and for a motion texture within a disk aperture.

Read more…

compiling notebooks into a report

For a master's project in computational neuroscience, we adopted a quite novel workflow to go all the steps from the learning of the small steps to the wrtiting of the final thesis. Though we were flexible in our method during the 6 months of this work, a simple workflow emerged that I describe here.

Compiling a set of notebook to a LaTeX document.

Read more…

A bit more fun with gravity waves

More fun with gravity waves

Motion Clouds were defined in the origin to provide a simple parameterization for textures. Thus we used a simple unimodal, normal distribution (on the log-radial frequency space to be more precise). But the larger set of Random Phase Textures may provide some interesting examples, some of them can even be fun! This is the case of this simulation of the waves you may observe on the surface on the ocean.

Main features of gravitational waves are:

  1. longer waves travel faster (tsunami are fast and global, ripples are slow and local) - speed is linearly proportional to wavelength
  2. phase speed (following a wave's crest) is twice as fast as group speed (following a group of waves).

More info about deep water waves : http://farside.ph.utexas.edu/teaching/336L/Fluidhtml/node122.html

Read more…

IRM clouds

A feature of MotionClouds is the ability to precisely tune the precision of information following the principal axes. One which is particularly relevant for the primary visual cortical area of primates (area V1) is to tune the otirentation mean and bandwidth.

Studying the role of contrast in V1 using MotionClouds

Read more…

Mirror clouds

An essential component of natural images is that they may contain order at large scales such as symmetries. Let's try to generate some textures with an axial (arbitrarily vertical) symmetry and take advantage of the different properties of random phase textures.

Read more…

élasticité trames V1

L'installation Elasticité dynamique agit comme un filtre et génère de nouveaux espaces démultipliés, comme un empilement quasi infini d'horizons. Par principe de réflexion, la pièce absorbe l'image de l'environnement et accumule les points de vue ; le mouvement permanent requalifie continuellement ce qui est regardé et entendu.

On va maintenant utiliser des forces elastiques pour coordonner la dynamique des lames dans la trame.

Read more…

bootstraping posts for élasticité

L'installation Elasticité dynamique agit comme un filtre et génère de nouveaux espaces démultipliés, comme un empilement quasi infini d'horizons. Par principe de réflexion, la pièce absorbe l'image de l'environnement et accumule les points de vue ; le mouvement permanent requalifie continuellement ce qui est regardé et entendu.

.. media:: http://vimeo.com/150813922

Ce meta-post gère la publication sur https://laurentperrinet.github.io/sciblog.

Read more…

élasticité - scénario final montage

L'installation Elasticité dynamique agit comme un filtre et génère de nouveaux espaces démultipliés, comme un empilement quasi infini d'horizons. Par principe de réflexion, la pièce absorbe l'image de l'environnement et accumule les points de vue ; le mouvement permanent requalifie continuellement ce qui est regardé et entendu.

Ce post produit le montage final des séquences.

Read more…

élasticité - scénario onde

L'installation Elasticité dynamique agit comme un filtre et génère de nouveaux espaces démultipliés, comme un empilement quasi infini d'horizons. Par principe de réflexion, la pièce absorbe l'image de l'environnement et accumule les points de vue ; le mouvement permanent requalifie continuellement ce qui est regardé et entendu.

Ce post crée des ondes se propageant sur la série de lames.

Read more…

élasticité, geometrie

L'installation Elasticité dynamique agit comme un filtre et génère de nouveaux espaces démultipliés, comme un empilement quasi infini d'horizons. Par principe de réflexion, la pièce absorbe l'image de l'environnement et accumule les points de vue ; le mouvement permanent requalifie continuellement ce qui est regardé et entendu.

Ce post implémente une configuration favorisant des angles droits.

Read more…

élasticité - scénario vague

L'installation Elasticité dynamique agit comme un filtre et génère de nouveaux espaces démultipliés, comme un empilement quasi infini d'horizons. Par principe de réflexion, la pièce absorbe l'image de l'environnement et accumule les points de vue ; le mouvement permanent requalifie continuellement ce qui est regardé et entendu.

Ce post implémente une configuration implémentant une vague de propagation.

Read more…

élasticité expansion en miroir - dynamique d'un point focal

L'installation Elasticité dynamique agit comme un filtre et génère de nouveaux espaces démultipliés, comme un empilement quasi infini d'horizons. Par principe de réflexion, la pièce absorbe l'image de l'environnement et accumule les points de vue ; le mouvement permanent requalifie continuellement ce qui est regardé et entendu.

Ce post implémente une dynamique sur le point focal.

Read more…

élasticité expansion en miroir - exploration paramètres

L'installation Elasticité dynamique agit comme un filtre et génère de nouveaux espaces démultipliés, comme un empilement quasi infini d'horizons. Par principe de réflexion, la pièce absorbe l'image de l'environnement et accumule les points de vue ; le mouvement permanent requalifie continuellement ce qui est regardé et entendu.

Ce post explore les paramètres de la structure et de l'extension des reflections.

Read more…

élasticité expansion en miroir - principes

L'installation Elasticité dynamique agit comme un filtre et génère de nouveaux espaces démultipliés, comme un empilement quasi infini d'horizons. Par principe de réflexion, la pièce absorbe l'image de l'environnement et accumule les points de vue ; le mouvement permanent requalifie continuellement ce qui est regardé et entendu.

Ce post étudie quelques principes fondamentaux relatifs à des reflections mutliples dans des mirroirs.

Read more…

élasticité expansion

L'installation Elasticité dynamique agit comme un filtre et génère de nouveaux espaces démultipliés, comme un empilement quasi infini d'horizons. Par principe de réflexion, la pièce absorbe l'image de l'environnement et accumule les points de vue ; le mouvement permanent requalifie continuellement ce qui est regardé et entendu.

Ce post étudie commment sampler des points sur la structure.

Read more…

élasticité expansion-réaction diffusion

L'installation Elasticité dynamique agit comme un filtre et génère de nouveaux espaces démultipliés, comme un empilement quasi infini d'horizons. Par principe de réflexion, la pièce absorbe l'image de l'environnement et accumule les points de vue ; le mouvement permanent requalifie continuellement ce qui est regardé et entendu.

Ce post étudie une reaction de reaction diffusion sur la structure.

Read more…

élasticité rapsberry pyserial

L'installation Elasticité dynamique agit comme un filtre et génère de nouveaux espaces démultipliés, comme un empilement quasi infini d'horizons. Par principe de réflexion, la pièce absorbe l'image de l'environnement et accumule les points de vue ; le mouvement permanent requalifie continuellement ce qui est regardé et entendu.

Ce post étudie la connection entre le raspberry π (qui fait tourner les simulations) et les arduino (qui commandent les moteurs).

Read more…

élasticité, control scenario

L'installation Elasticité dynamique agit comme un filtre et génère de nouveaux espaces démultipliés, comme un empilement quasi infini d'horizons. Par principe de réflexion, la pièce absorbe l'image de l'environnement et accumule les points de vue ; le mouvement permanent requalifie continuellement ce qui est regardé et entendu.

Ce post simule une configuration de contrôle sur l'ensemble de la structure.

Read more…

élasticité, Fresnel

L'installation Elasticité dynamique agit comme un filtre et génère de nouveaux espaces démultipliés, comme un empilement quasi infini d'horizons. Par principe de réflexion, la pièce absorbe l'image de l'environnement et accumule les points de vue ; le mouvement permanent requalifie continuellement ce qui est regardé et entendu.

Ce post simule une configuration de type Fresnel sur l'ensemble de la structure.

Read more…

élasticité, vapory and reflections

L'installation Elasticité dynamique agit comme un filtre et génère de nouveaux espaces démultipliés, comme un empilement quasi infini d'horizons. Par principe de réflexion, la pièce absorbe l'image de l'environnement et accumule les points de vue ; le mouvement permanent requalifie continuellement ce qui est regardé et entendu.

Ce post simule un rendu de reflection utilisant povray.

A scene with mirrors rendered with vapory (see https://laurentperrinet.github.io/sciblog/posts/2015-01-16-rendering-3d-scenes-in-python.html )

Read more…

A hitchhiker guide to Matching Pursuit

The Matching Pursuit algorithm is popular in signal processing and applies well to digital images.

I have contributed a python implementation and we will show here how we may use that for extracting a sparse set of edges from an image.


@inbook{Perrinet15bicv,
    title = {Sparse models},
    author = {Perrinet, Laurent U.},
    booktitle = {Biologically-inspired Computer Vision},
    chapter = {13},
    editor = {Keil, Matthias and Crist\'{o}bal, Gabriel and Perrinet, Laurent U.},
    publisher = {Wiley, New-York},
    year = {2015}
}

Read more…

A simple pre-processing filter for image processing

When processing images, it is useful to avoid artifacts, in particular when you try to understand biological processes. In the past, I have used natural images (found on internet, grabbed from holiday pictures, ...) without controlling for possible problems.

In particular, digital pictures are taken on pixels which are most often placed on a rectangular grid. It means that if you rotate that image, you may lose information and distort it and thus get wrong results (even for the right algorithm!). Moreover, pictures have a border while natural scenes do not, unless you are looking at it through an aperture. Intuitively, this means that large objects would not fit on the screen and are less informative.

In computer vision, it is easier to handle these problems in Fourier space. There, an image (that we suppose square for simplicity) is transformed in a matrix of coefficients of the same size as the image. If you rotate the image, the Fourier spectrum is also rotated. But as you rotate the image, the information that was in the corners of the original spectrum may span outside the spectrum of the rotated image. Also, the information in the center of the spectrum (around low frequencies) is less relevant than the rest.

Here, we will try to keep as much information about the image as possible, while removing the artifacts related to the process of digitalizing the picture.

Read more…

trame-sensorielle

L'installation Elasticité dynamique agit comme un filtre et génère de nouveaux espaces démultipliés, comme un empilement quasi infini d'horizons. Par principe de réflexion, la pièce absorbe l'image de l'environnement et accumule les points de vue ; le mouvement permanent requalifie continuellement ce qui est regardé et entendu.

Ce post utilise une image naturelle comme entrée d'une "trame sensorielle".

Read more…

elastic-force

L'installation Elasticité dynamique agit comme un filtre et génère de nouveaux espaces démultipliés, comme un empilement quasi infini d'horizons. Par principe de réflexion, la pièce absorbe l'image de l'environnement et accumule les points de vue ; le mouvement permanent requalifie continuellement ce qui est regardé et entendu.

On va maintenant utiliser des forces elastiques pour coordonner la dynamique des lames dans la trame.

Read more…

The Vancouver set

I have heard Vancouver can get foggy and cloudy in the winter. Here, I will provide some examples of realistic simulations of it...

This stimulation was used in the following poster presented at VSS:


@article{Kreyenmeier2016,
author = {Kreyenmeier, Philipp and Fooken, Jolande and Spering, Miriam},
doi = {10.1167/16.12.457},
issn = {1534-7362},
journal = {Journal of Vision},
month = {sep},
number = {12},
pages = {457},
publisher = {The Association for Research in Vision and Ophthalmology},
title = {{Similar effects of visual context dynamics on eye and hand movements}},
url = {http://jov.arvojournals.org/article.aspx?doi=10.1167/16.12.457},
volume = {16},
year = {2016}
}

Read more…

Creating an animation using Gizeh + MoviePy

Gizeh (that is, Cairo for tourists) is a great interface to the Cairo drawing library.

I recently wished to make a small animation of a bar moving in the visual field and crossing a simple receptive field to illustrate some simple motions that could be captured in the primary visual cortex ansd experiments that could be done there.

Read more…

Rendering 3D scenes in python

The above snippet shows how you can create a 3D rendered scene in a few lines of codes (from http://zulko.github.io/blog/2014/11/13/things-you-can-do-with-python-and-pov-ray/):

In [1]:
import vapory

camera = vapory.Camera( 'location', [0, 2, -3], 'look_at', [0, 1, 2] )
light = vapory.LightSource( [2, 4, -3], 'color', [1, 1, 1] )
sphere = vapory.Sphere( [0, 1, 2], 2, vapory.Texture( vapory.Pigment( 'color', [1, 0, 1] )))

scene = vapory.Scene(camera = camera , # a Camera object
                     objects = [light, sphere], # POV-Ray objects (items, lights)
                     included = ["colors.inc"]) # headers that POV-Ray may need

# passing 'ipython' as argument at the end of an IPython Notebook cell
# will display the picture in the IPython notebook.
scene.render('ipython', width=900, height=500)
Out[1]:
No description has been provided for this image

Here are more details...

Read more…

The right imports in a notebook

Following this post http://carreau.github.io/posts/10-No-PyLab-Thanks.ipynb.html, here is ---all in one single cell--- the bits necessary to import most useful libraries in an ipython notebook:

In [1]:
# import numpy and set the printed precision to something humans can read
import numpy as np
np.set_printoptions(precision=2, suppress=True)
# set some prefs for matplotlib
import matplotlib.pyplot as plt
import matplotlib
matplotlib.rcParams.update({'text.usetex': True})
fig_width_pt = 700.  # Get this from LaTeX using \showthe\columnwidth
inches_per_pt = 1.0/72.27               # Convert pt to inches
fig_width = fig_width_pt*inches_per_pt  # width in inches
FORMATS = ['pdf', 'eps']
phi = .5*np.sqrt(5) + .5 # useful ratio for figures
# define plots to be inserted interactively
%matplotlib inline
#%config InlineBackend.figure_format='retina' # high-def PNGs, quite bad when using file versioning
%config InlineBackend.figure_format='svg'

Below, I detail some thoughts on why it is a perfect preamble for most ipython notebooks.

Read more…

Recruiting different population ratios in V1 using orientation components: defining a protocol

A feature of MotionClouds is the ability to precisely tune the precision of information following the principal axes. One which is particularly relevant for the primary visual cortical area of primates (area V1) is to tune the otirentation mean and bandwidth.

This is part of a larger study to tune orientation bandwidth.

summary of the electro-physiology protocol

Read more…

Polar bar plots

I needed to show prior information for the orientation of contours in natural images showing a preference for cardinal axis. A polar plot showing seemed to be a natural choice for showing the probability distribution function. However, this seems visually flawed...

Read more…

Reading KML My Tracks files in ipython

It's easy to record tracks (for instance while running) using the "My tracks" app on android systems. What about being able to re-use them?

In :doc:2014-11-22-reading-kml-my-tracks-files-in-ipython we reviewed different approches. Let's now try to use this data.

Read more…

Reading KML My Tracks files in ipython

It's easy to record tracks (for instance while running) using the "My tracks" app on android systems. What about being able to re-use them?

Here, I am reviewing some methods to read a KML file, including fastkml, pykml, to finally opt for a custom method with the xmltodict package.

Read more…

Recruiting different population ratios in V1 using orientation components: a biphoton study

A feature of MotionClouds is the ability to precisely tune the precision of information following the principal axes. One which is particularly relevant for the primary visual cortical area of primates (area V1) is to tune the otirentation mean and bandwidth.

To install the necessary libraries, check out the documentation.

summary of the biphoton protocol

For the biphoton experiment:

  • The refresh rate of the screen is 70Hz and stimulation for 5 times 1s, which makes 350 images.
  • for the spatial frequency 0.125 cyc/deg is optimal (between 0.01 and 0.16).
  • for the temporal frequency 2 cyc/sec is optimal (between 0.8 and 4 sic/sec), we manipulate $B_V$ to get a qualitative estimate.

Read more…

A bit of fun with gravity waves

A bit of fun with gravity waves

Motion Clouds were defined in the origin to provide a simple parameterization for textures. Thus we used a simple unimodal, normal distribution (on the log-radial frequency space to be more precise). But the larger set of Random Phase Textures may provide some interesting examples, some of them can even be fun! This is the case of this simulation of the waves you may observe on the surface on the ocean.

In [1]:
from IPython.display import HTML
HTML('<center><video controls autoplay loop src="../files/2014-10-24_waves/waves.mp4" width=61.8%/></center>')
Out[1]:

Main features of gravitational waves are:

  1. longer waves travel faster (tsunami are fast and global, ripples are slow and local) - speed is linearly proportional to wavelength
  2. phase speed (following a wave's crest) is twice as fast as group speed (following a group of waves).

Motion Plaids

MotionPlaids : from MotionClouds components to a plaid-like stimulus

In [1]:
import numpy as np
import MotionClouds as mc
downscale = 2
fx, fy, ft = mc.get_grids(mc.N_X/downscale, mc.N_Y/downscale, mc.N_frame/downscale)
name = 'MotionPlaid'

mc.figpath = '../files/2014-10-20_MotionPlaids'
import os
if not(os.path.isdir(mc.figpath)): os.mkdir(mc.figpath)

Plaids are usually created by adding two moving gratings (the components) to form a new simulus (the pattern). Such stimuli are crucial to understand how for instance information about motion is represented and processed and its neural mechanisms have been extensively studied notably by Anthony Movshon at the NYU. One shortcomming is the fact that these are created by components which created interference patterns when they are added (as in a Moiré pattern). The question remains to know if everything that we know about components vs pattern processing comes from these interference patterns or reaaly by the processing of the two componenents as a whole. As such, Motion Clouds are ideal candidates because they are generated with random phases: by construction, there should not be any localized interference between components. Let's verfy that:

Defintion of parameters:

In [2]:
theta1, theta2, B_theta = np.pi/4., -np.pi/4., np.pi/32

This figure shows how one can create MotionCloud stimuli that specifically target component and pattern cell. We show in the different lines of this table respectively: Top) one motion cloud component (with a strong selectivity toward the orientation perpendicular to direction) heading in the upper diagonal Middle) a similar motion cloud component following the lower diagonal Bottom) the addition of both components: perceptually, the horizontal direction is predominant.

In [3]:
print( mc.in_show_video.__doc__)

    Columns represent isometric projections of a cube. The left column displays
    iso-surfaces of the spectral envelope by displaying enclosing volumes at 5
    different energy values with respect to the peak amplitude of the Fourier spectrum.
    The middle column shows an isometric view of the faces of the movie cube.
    The first frame of the movie lies on the x-y plane, the x-t plane lies on the
    top face and motion direction is seen as diagonal lines on this face (vertical
    motion is similarly see in the y-t face). The third column displays the actual
    movie as an animation.

    Given a name, displays the figures corresponding to the Fourier spectra, the
    stimulus cubes and movies within the notebook.


Component one:

In [4]:
diag1 = mc.envelope_gabor(fx, fy, ft, theta=theta1, V_X=np.cos(theta1), V_Y=np.sin(theta1), B_theta=B_theta)
name_ = name + '_comp1'
mc.figures(diag1, name_, seed=12234565, figpath=mc.figpath)
mc.in_show_video(name_, figpath=mc.figpath)
No description has been provided for this image

Component two:

In [5]:
diag2 = mc.envelope_gabor(fx, fy, ft, theta=theta2, V_X=np.cos(theta2), V_Y=np.sin(theta2), B_theta=B_theta)
name_ = name + '_comp2'
mc.figures(diag2, name_, seed=12234565, figpath=mc.figpath)
mc.in_show_video(name_, figpath=mc.figpath)
No description has been provided for this image

The pattern is the sum of the two components:

In [6]:
name_ = name
mc.figures(diag1 + diag2, name, seed=12234565, figpath=mc.figpath)
mc.in_show_video(name_, figpath=mc.figpath)
No description has been provided for this image

A grid of plaids shows switch from transparency to pattern motion

Script done in collaboration with Jean Spezia.

In [7]:
import os
import numpy as np
import MotionClouds as mc

name = 'MotionPlaid_9x9'
if mc.check_if_anim_exist(name):
    B_theta = np.pi/32
    N_orient = 9
    downscale = 4
    fx, fy, ft = mc.get_grids(mc.N_X//downscale, mc.N_Y//downscale, mc.N_frame//downscale)
    mov = mc.np.zeros(((N_orient*mc.N_X//downscale), (N_orient*mc.N_X//downscale), mc.N_frame//downscale))
    i = 0
    j = 0
    for theta1 in np.linspace(0, np.pi/2, N_orient)[::-1]:
        for theta2 in np.linspace(0, np.pi/2, N_orient):
            diag1 = mc.envelope_gabor(fx, fy, ft, theta=theta1, V_X=np.cos(theta1), V_Y=np.sin(theta1), B_theta=B_theta)
            diag2 = mc.envelope_gabor(fx, fy, ft, theta=theta2, V_X=np.cos(theta2), V_Y=np.sin(theta2), B_theta=B_theta)
            mov[(i)*mc.N_X//downscale:(i+1)*mc.N_X//downscale, (j)*mc.N_Y//downscale : (j+1)*mc.N_Y//downscale, :] = mc.random_cloud(diag1 + diag2, seed=1234)
            j += 1
        j = 0
        i += 1
    mc.anim_save(mc.rectif(mov, contrast=.99), os.path.join(mc.figpath, name))
In [8]:
mc.in_show_video(name, figpath=mc.figpath)

As in (Rust, 06) we show in this table the concatenation of a table of 9x9 MotionPlaids where the angle of the components vary on respectively the horizontal and vertical axes.
The diagonal from the bottom left to the top right corners show the addition of two component MotionClouds of similar direction: They are therefore also intance of the same Motion Clouds and thus consist in a single component.
As one gets further away from this diagonal, the angle between both component increases, as can be seen in the figure below. Note that first and last column are different instance of similar MotionClouds, just as first and last lines in in the table.

A parametric exploration on MotionPlaids

In [9]:
N_orient = 8
downscale = 2
fx, fy, ft = mc.get_grids(mc.N_X/downscale, mc.N_Y/downscale, mc.N_frame)
theta = 0
for dtheta in np.linspace(0, np.pi/2, N_orient):
    name_ = name + 'dtheta_' + str(dtheta).replace('.', '_')
    diag1 = mc.envelope_gabor(fx, fy, ft, theta=theta + dtheta, V_X=np.cos(theta + dtheta), V_Y=np.sin(theta + dtheta), B_theta=B_theta)
    diag2 = mc.envelope_gabor(fx, fy, ft, theta=theta - dtheta, V_X=np.cos(theta - dtheta), V_Y=np.sin(theta - dtheta), B_theta=B_theta)
    mc.figures(diag1 + diag2, name_, seed=12234565, figpath=mc.figpath)
    mc.in_show_video(name_, figpath=mc.figpath)
No description has been provided for this image

For clarity, we display MotionPlaids as the angle between both component increases from 0 to pi/2.
Left column displays iso-surfaces of the spectral envelope by displaying enclosing volumes at 5 different energy values with respect to the peak amplitude of the Fourier spectrum.
Right column of the table displays the actual movie as an animation.

transferring (lots of) files to a remote server + saving space

I have recently been asked how to transfer lots of file from a backup server to a local disk. The context is that

  1. the backup is an archive to be put on an external hard drive and then in a closet for future use,
  2. the transfer line is not quite reliable and transfers may stop (for instance if it is mounted as a samba / windows / applefile share)

Read more…

[Stage M1] Chloé Pasturel : week 5

Loi de Von mises :

La densité est définie sur $[0, 2\pi[$ par $ f(x) = \frac {e^{\kappa cos(\theta - m)}}{2 \pi I_{0}(\kappa)} ~$
avec $~ \kappa = \frac {1}{\sigma^{2}} $

L'orientation est définie sur $[0, \pi[$ par un remplaçant de la variable $~ (\theta_d - m) ~$ par $~ 2(\theta_o - m)$

nous obtenons alors la densité pour $\theta_o$: $ f(x) = \frac{1}{2 \pi I_{0}(\kappa)} \cdot {e^{\frac{cos(2(\theta - m))}{\sigma^{2}}}}$ et $~ p = \frac {1} {2\pi \sigma_1 \sigma_2} \cdot e^{- 2 \frac{(m_2-m_1)^{2}}{\sigma_{1}^{2} + \sigma_{2}^{2}}}$

car avec le changement de variable : $ \varepsilon(x) = \frac {1} {\sigma_{1} \sqrt{2\pi}} \cdot e^{\frac {-(2(x-m_{1}))^{2}} {2\sigma_{1}^{2}}} $ et $\gamma (x) = \frac {1} {\sigma_2 \sqrt{2\pi}} \cdot e^{\frac {-(2(x-m_2))^{2}} {2\sigma_{2}^{2}}} $

donc $\varepsilon(x) \cdot \gamma(x) = \frac {1}{2\pi \sigma_{1} \sigma_{2}} \cdot e^{-2(\frac {(x-m_{1})^{2}}{\sigma_{1}^{2}} + \frac{(x-m_{2})^{2}}{\sigma_{2}^{2}})} = \frac {1} {2\pi \sigma_1 \sigma_2} \cdot e^{- 2 \frac{(m_2-m_1)^{2}}{\sigma_{1}^{2} + \sigma_{2}^{2}}}$

Read more…

[Stage M1] Chloé Pasturel : week 3

Travail sur les Motion Clouds et observation des différents changement de paramètre particulièrement B_sf

  • introduction aux motions clouds: installation et display dans un notebook
  • synthèse de clouds avec différents theta
  • synthèse avec différents B_theta (V=0)
  • utilisation du trick dans https://laurentperrinet.github.io/sciblog/posts/2015-07-02_smooth-transition-between-mcs.html pour créer un stimulus pour lequel l'orientation tourne de 0 à 2*pi
  • proposer une façon simple de passer de ce signal à une entré pour le ring (un peu de maths? un MC est une texture définie en fourier, une cellule simple fait une convolution dans l'espace, donc une multiplication dans Fourier: on pourrait avoir la sortie linéaire du neurone de V1 directement ...)

http://neuralensemble.github.io/MotionClouds/

https://neuralensemble.github.io/MotionClouds

Read more…

[Stage M1] Chloé Pasturel : week 1

  • définition du sujet - lecture Hansel
  • mise en place du python notebook
  • demos de brian

installation des outils

  1. virtual box
  2. VM ubuntu
  3. <<< guest additions + clone
  4. neurodebian
    wget -O- http://neuro.debian.net/lists/trusty.de-md.full | sudo tee /etc/apt/sources.list.d/neurodebian.sources.list
    sudo apt-key adv --recv-keys --keyserver pgp.mit.edu 2649A5A9
    sudo apt-get update
  1. install on ubuntu
sudo apt-get install aptitude
sudo aptitude install ipython-notebook
sudo aptitude install python-matplotlib
sudo aptitude install python-brian 
sudo aptitude install texlive-full


sudo aptitude install python-pynn 
pip install --user neurotools 

Converting MoinMoin pages to Nikola

I have another wiki to take notes. These are written using the MoinMoin syntax, which is nice, but I found no converter from MoinMoin to anything compatible with Nikola.

Following this post http://carreau.github.io/posts/06-NBconvert-Doc-Draft.html , I thought I might give it a try using ipython within nikola:

In [1]:
URL = 'https://URL/cgi-bin/index.cgi/SciBlog/2005-10-29?action=print'

NOTE: this should not be tried with these URLS as they do not exist anymore...

Read more…

Trying out ipython blogging

How to easily publish an ipython notebook?

installing the appropriate plugins

Here, we will need to install additions to the nikola publishing tool: a rendering machine + a theme. Using homebrew in mcosx, this looks like:

brew install npm
npm install -g less

and

nikola install_theme zen-ipython

Once this was done, one could tune conf.py and then issue:

nikola new_post -f ipynb

Finally, one needs to build (nikola build) and publish (nikola deploy)

example

In [1]:
plot(rand(50))
Out[1]:
[<matplotlib.lines.Line2D at 0x10ab2d1d0>]
No description has been provided for this image