Recruiting different population ratios in V1 using orientation components
A feature of MotionClouds is the ability to precisely tune the precision of information following the principal axes. One which is particularly relevant for the primary visual cortical area of primates (area V1) is to tune the orientation mean and bandwidth.
This is part of a larger study to tune orientation bandwidth.
import os
import numpy as np
import MotionClouds as mc
downscale = 1
fx, fy, ft = mc.get_grids(mc.N_X/downscale, mc.N_Y/downscale, mc.N_frame/downscale)

name = 'balaV1'
mc.figpath = os.path.join('../files', '2014-11-10_balaV1-protocol')
if not(os.path.isdir(mc.figpath)): os.mkdir(mc.figpath)
N_X = fx.shape[0]
width = 29.7*256/1050
sf_0 = 4.*width/N_X
B_V = 2.5     # BW temporal frequency (speed plane thickness)
B_sf = sf_0   # BW spatial frequency
theta = 0.0   # Central orientation
B_theta_low, B_theta_high = np.pi/32, 2*np.pi
B_V = 0.5
seed=12234565

mc1 = mc.envelope_gabor(fx, fy, ft, V_X=0., V_Y=0., B_V=B_V, sf_0=sf_0, B_sf=B_sf, theta=theta, B_theta=B_theta_low)
mc2 = mc.envelope_gabor(fx, fy, ft, V_X=0., V_Y=0., B_V=B_V, sf_0=sf_0, B_sf=B_sf, theta=theta, B_theta=B_theta_high)
name_ = name + '_1'
mc.figures(mc1, name_, seed=seed, figpath=mc.figpath)
mc.in_show_video(name_, figpath=mc.figpath)
name_ = name + '_2'
mc.figures(mc2, name_, seed=seed, figpath=mc.figpath)
mc.in_show_video(name_, figpath=mc.figpath)
 |
||
 |
||
 |
||
 |
||
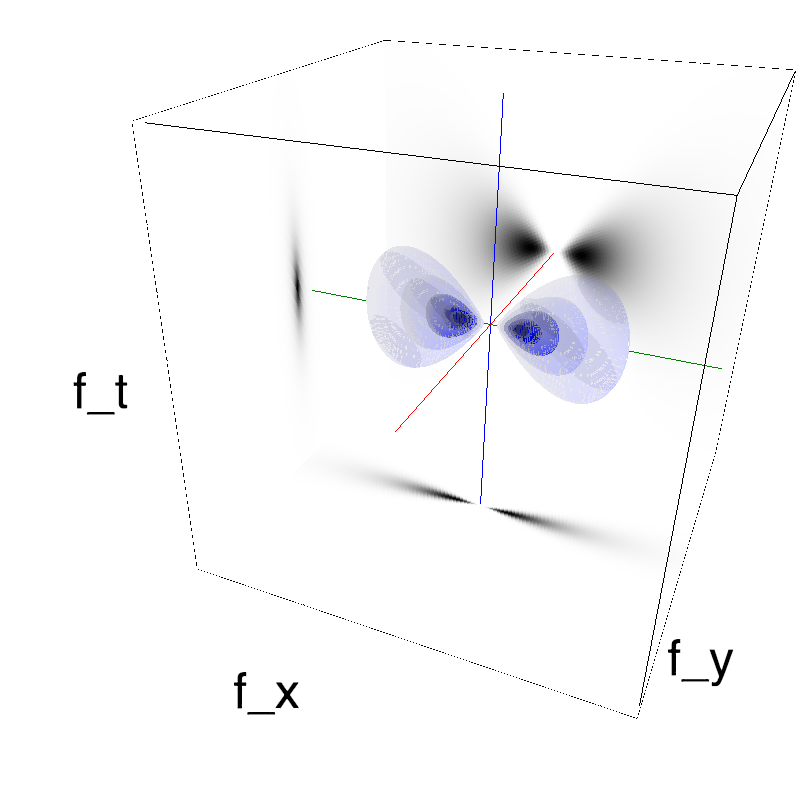
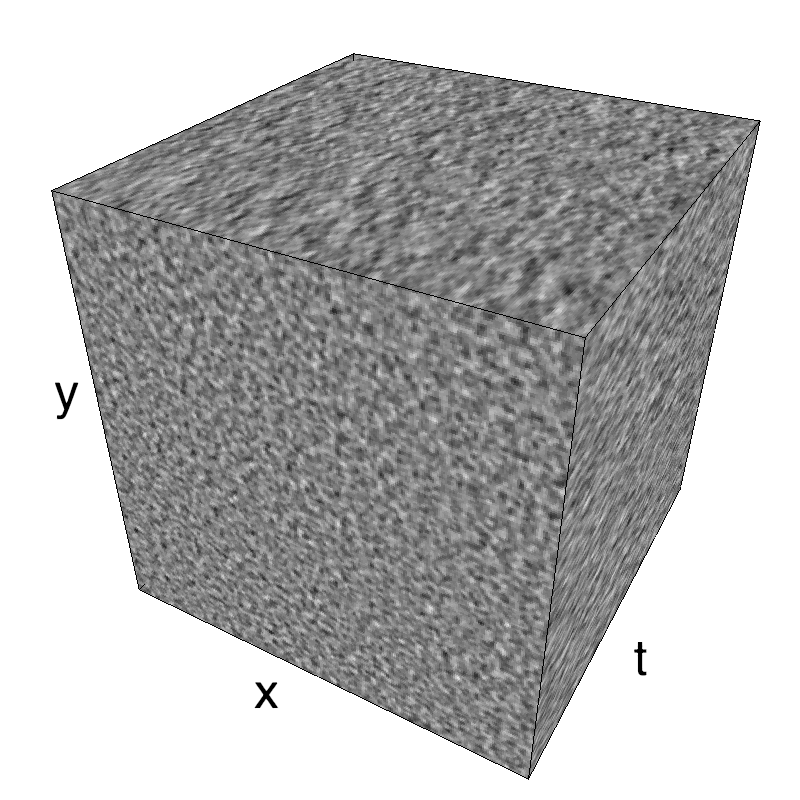
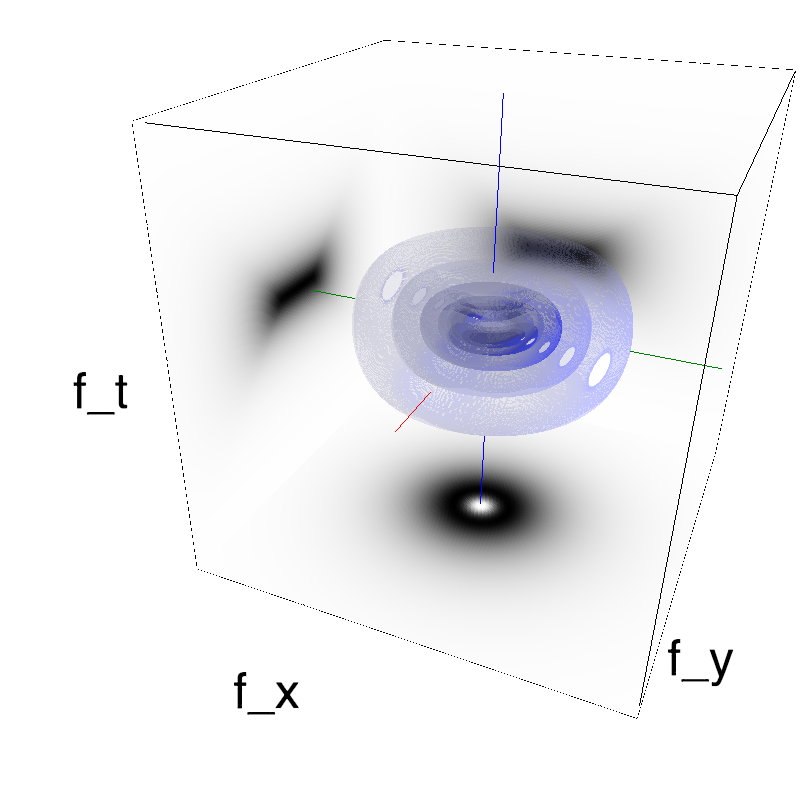
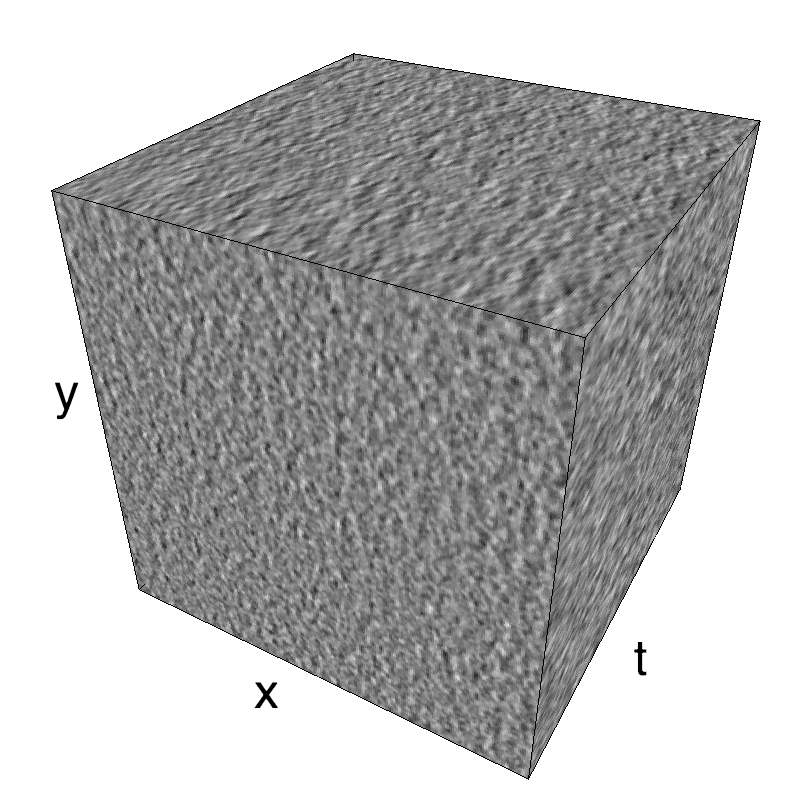
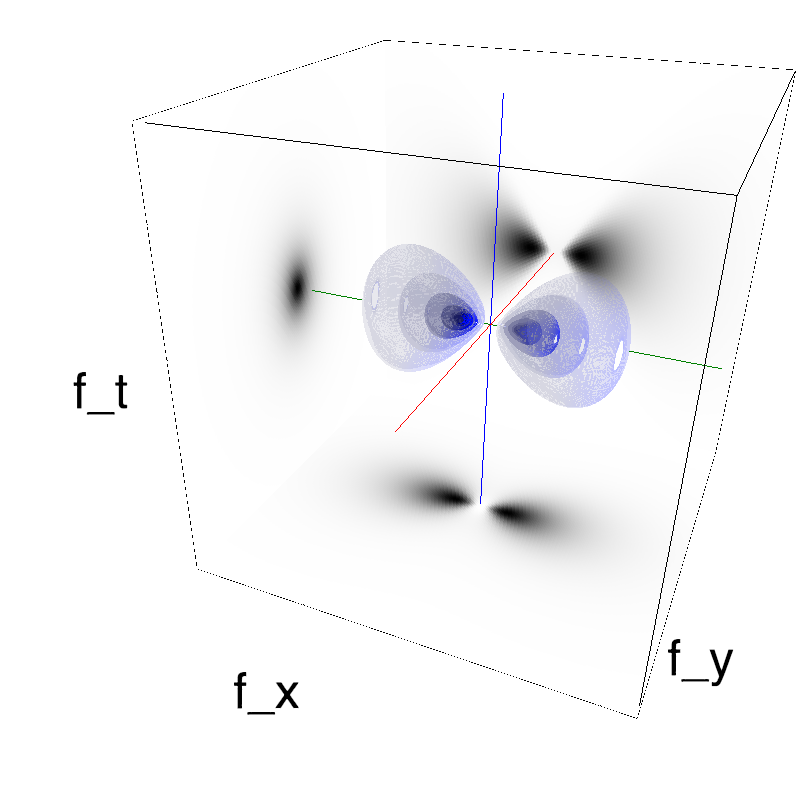
This figure shows how one can create different MotionCloud stimuli that specifically target different population in V1. We show in the two lines of this table motion cloud component with a (Top) narrow orientation bandwith (Bottom) a wide bandwitdh: perceptually, there is no predominant position or speed, just different orientation contents.
Columns represent isometric projections of a cube. The left column displays iso-surfaces of the spectral envelope by displaying enclosing volumes at 5 different energy values with respect to the peak amplitude of the Fourier spectrum.
The middle column shows an isometric view of the faces of the movie cube. The first frame of the movie lies on the x-y plane, the x-t plane lies on the top face and motion direction is seen as diagonal lines on this face (vertical motion is similarly see in the y-t face). The third column displays the actual movie as an animation.
Note: an analysis of the response of a neural network to such stimulations as been explored by Chloé Pasturel.
exploring different orientation bandwidths
for B_theta_ in B_theta_high*2.**-np.arange(7):
    name_ = name + '_B_theta_' + str(B_theta_).replace('.', '_')
    mc_i = mc.envelope_gabor(fx, fy, ft, V_X=0., V_Y=0., B_V=B_V, sf_0=sf_0, B_sf=B_sf,
                             theta=theta, B_theta=B_theta_)
    mc.figures(mc_i, name_, seed=seed, figpath=mc.figpath)
    mc.in_show_video(name_, figpath=mc.figpath)
 |
||
 |
||
 |
||
 |
||
 |
||
 |
||
 |
||
 |
||
 |
||
 |
||
 |
||
 |
||
 |
||
 |
||
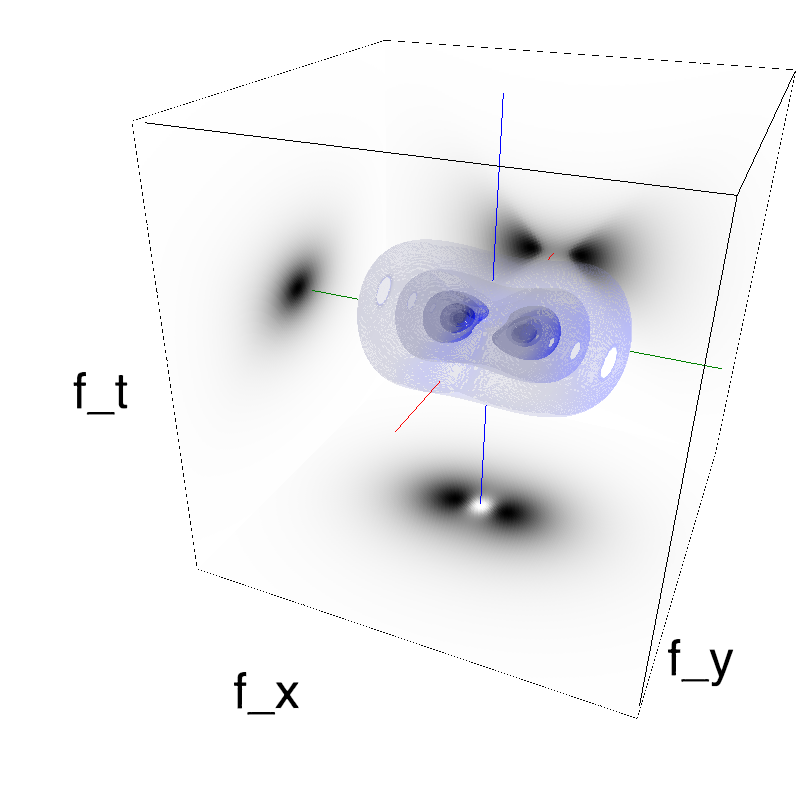
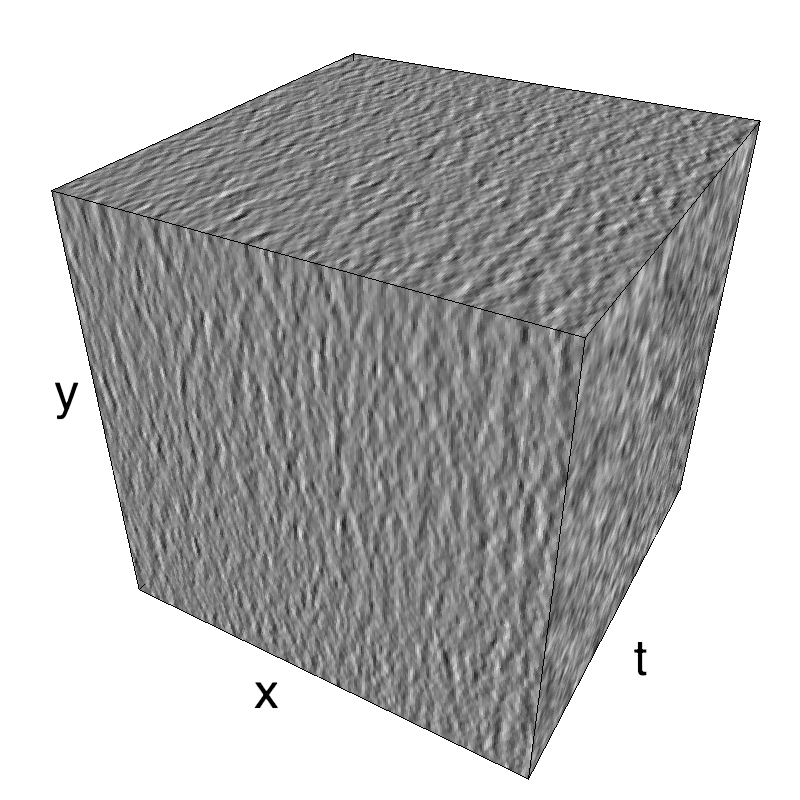
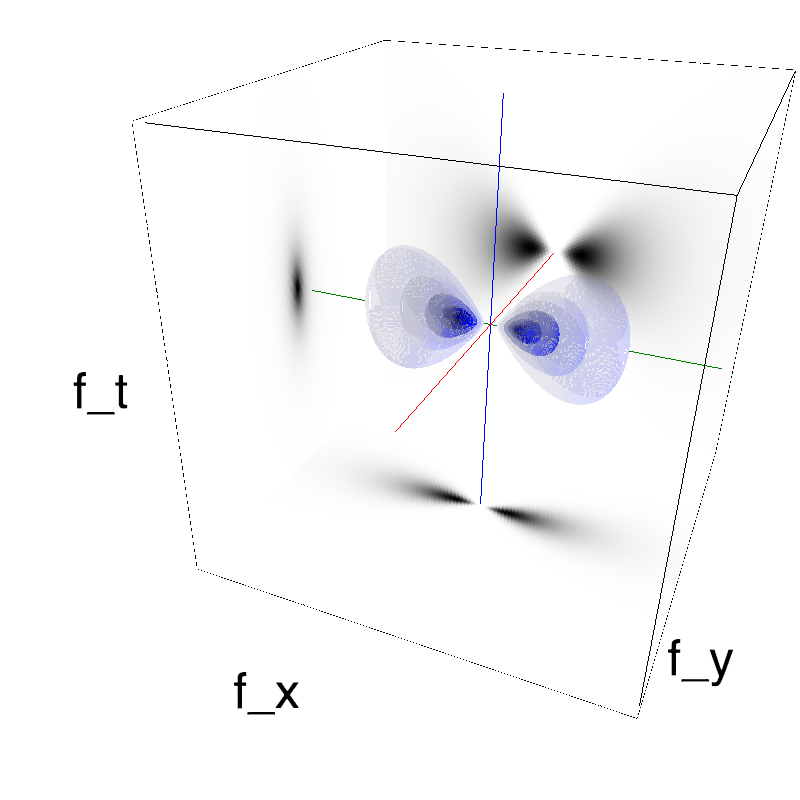
Here, we display MotionClouds as the orientation bandwidth increases from pi/32 to 2*pi. This should be equivalent in V1 to recruiting different ratios of neurons.
Left column displays iso-surfaces of the spectral envelope by displaying enclosing volumes at 5 different energy values with respect to the peak amplitude of the Fourier spectrum. Right column of the table displays the actual movie as an animation.
some book keeping for the notebook
%load_ext version_information
%version_information numpy, scipy, matplotlib, MotionClouds