Caustic (optics)
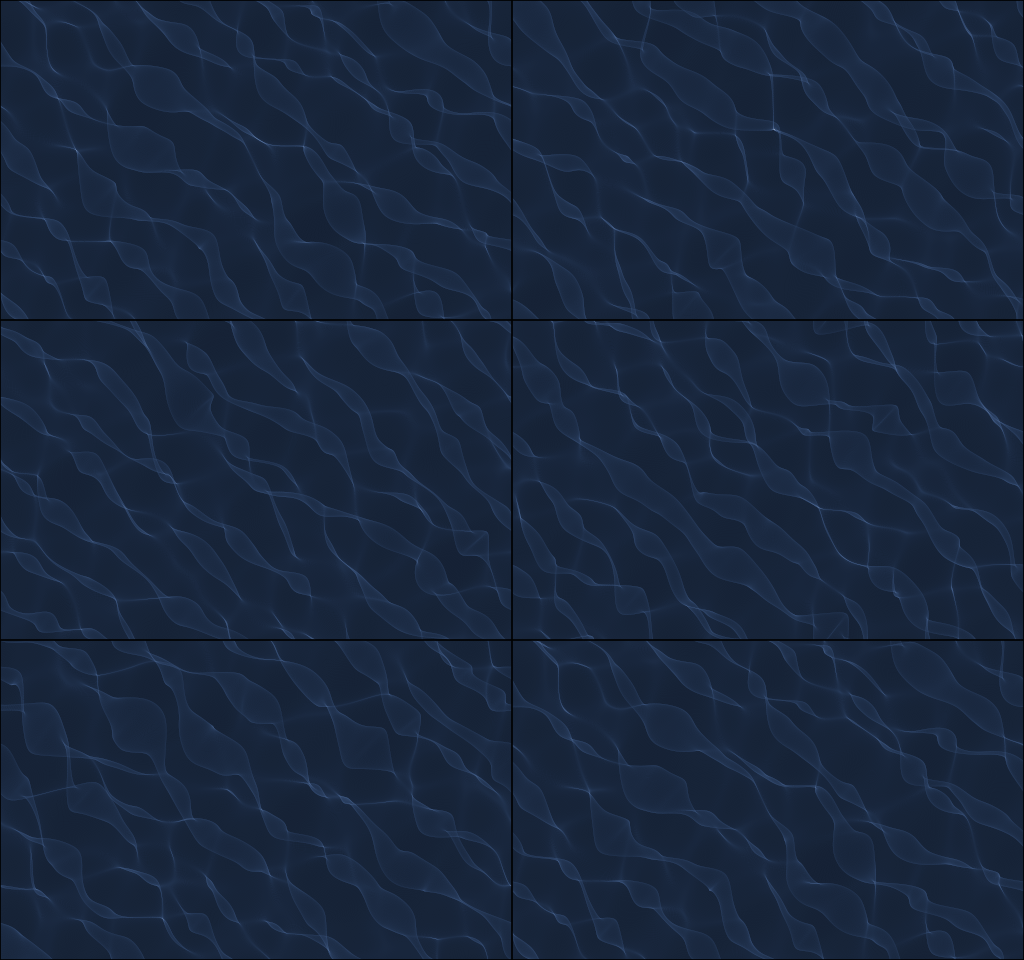
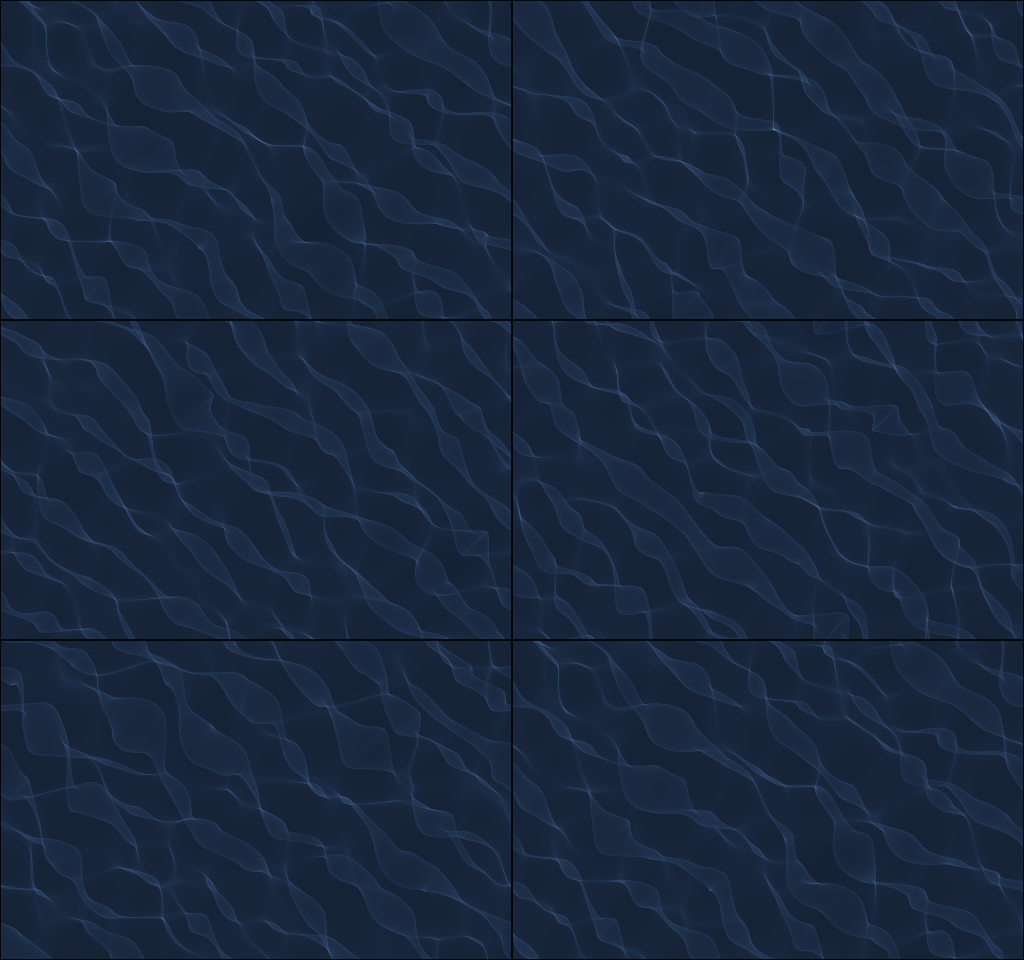
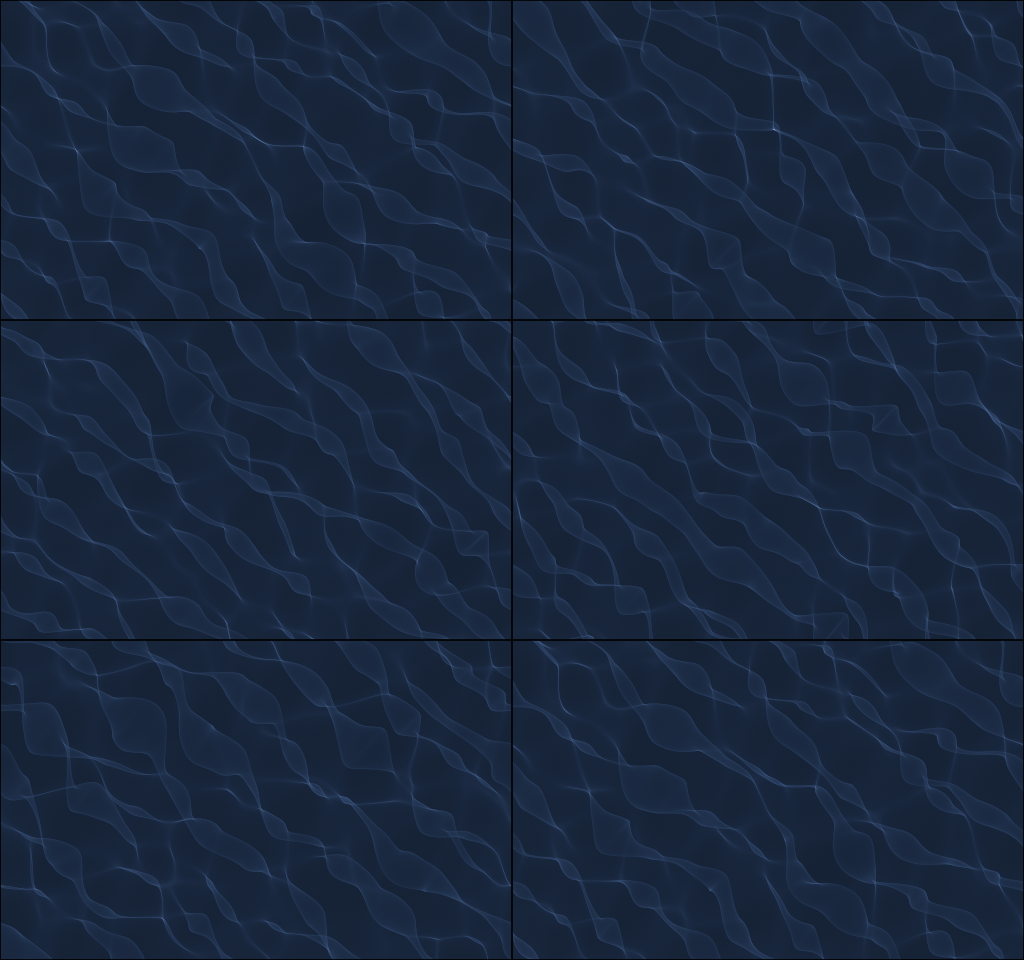
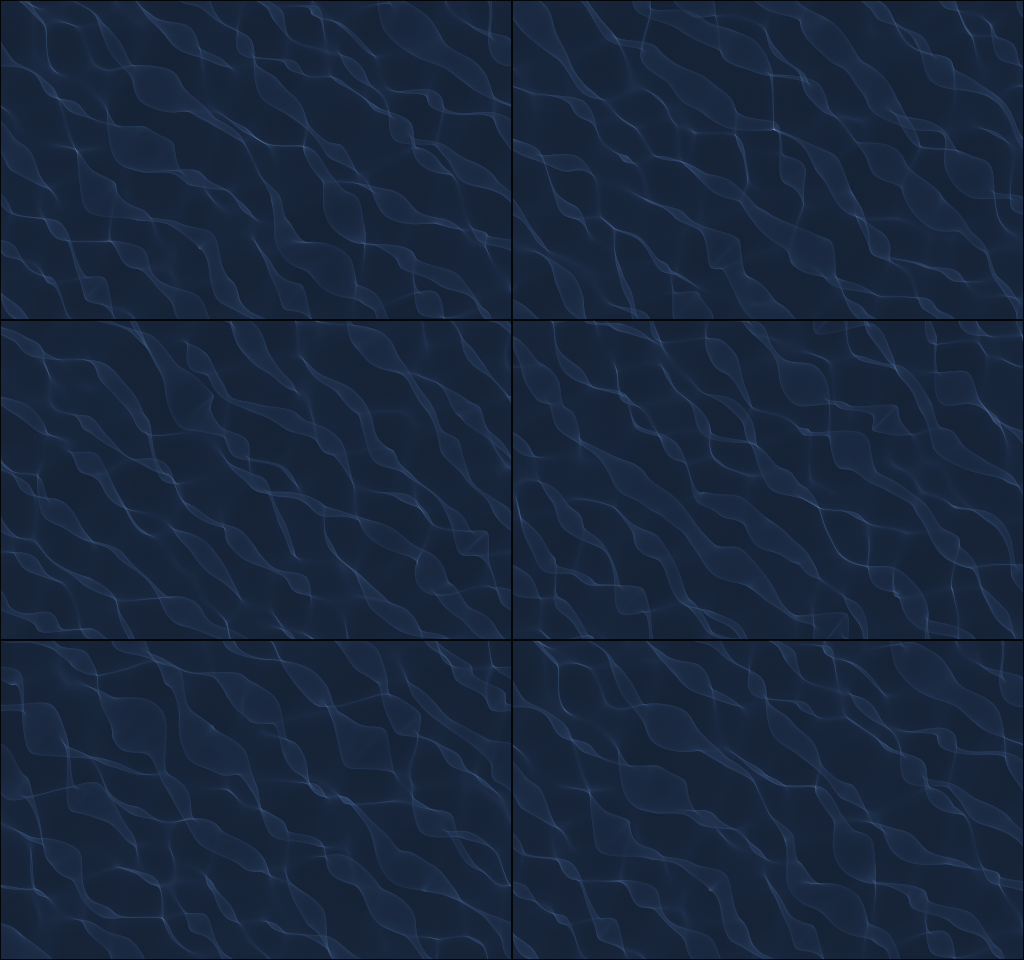
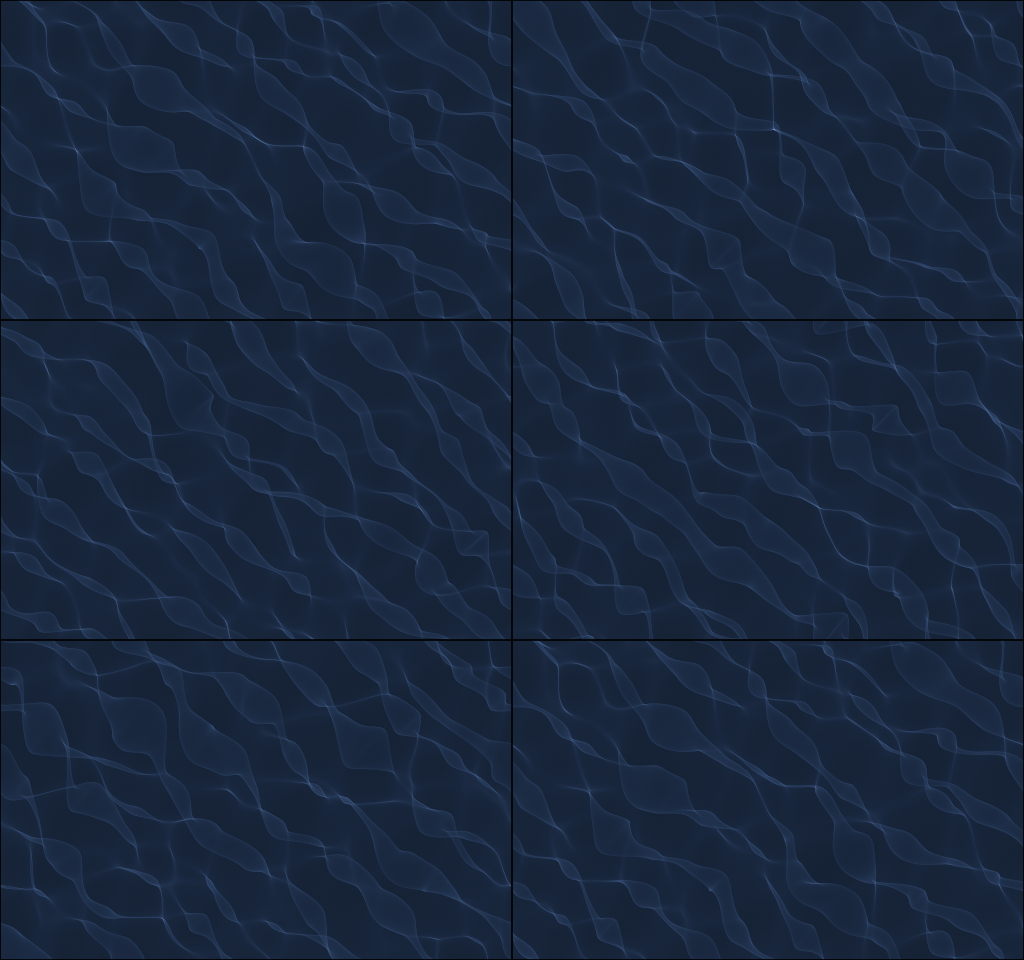
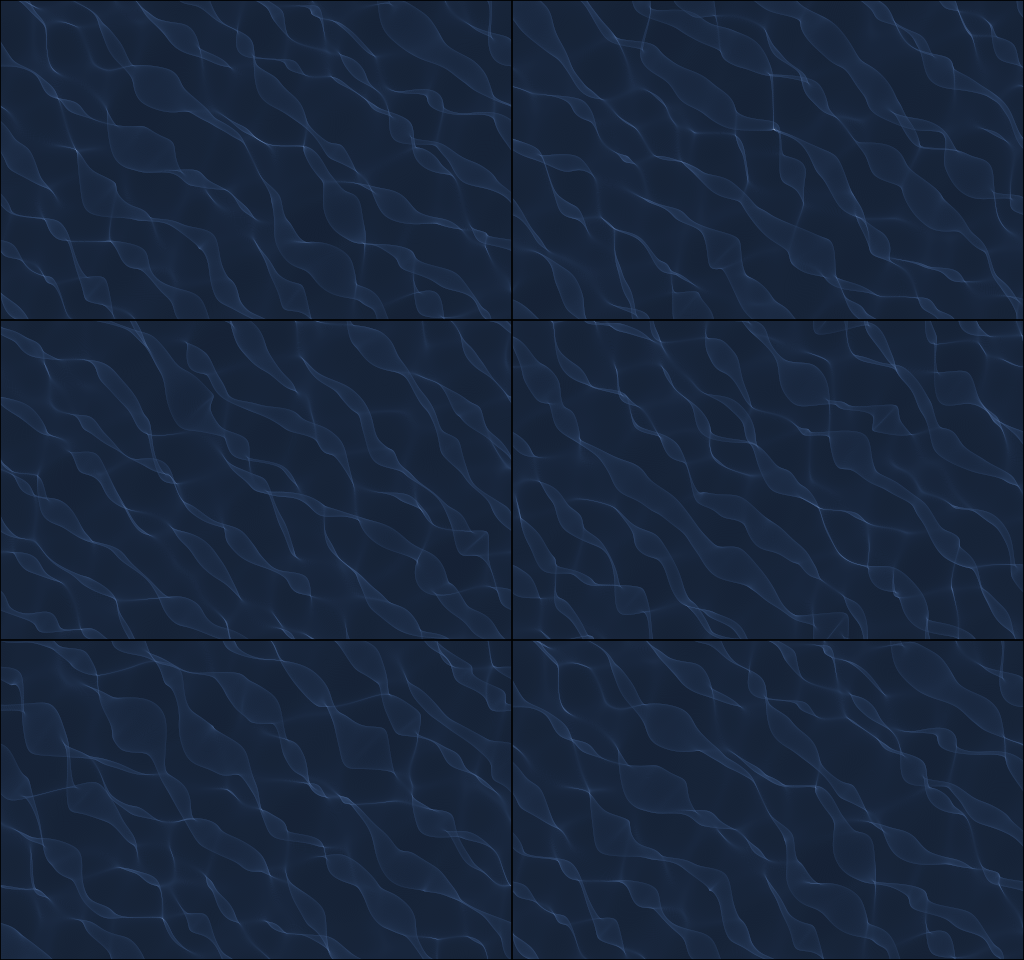
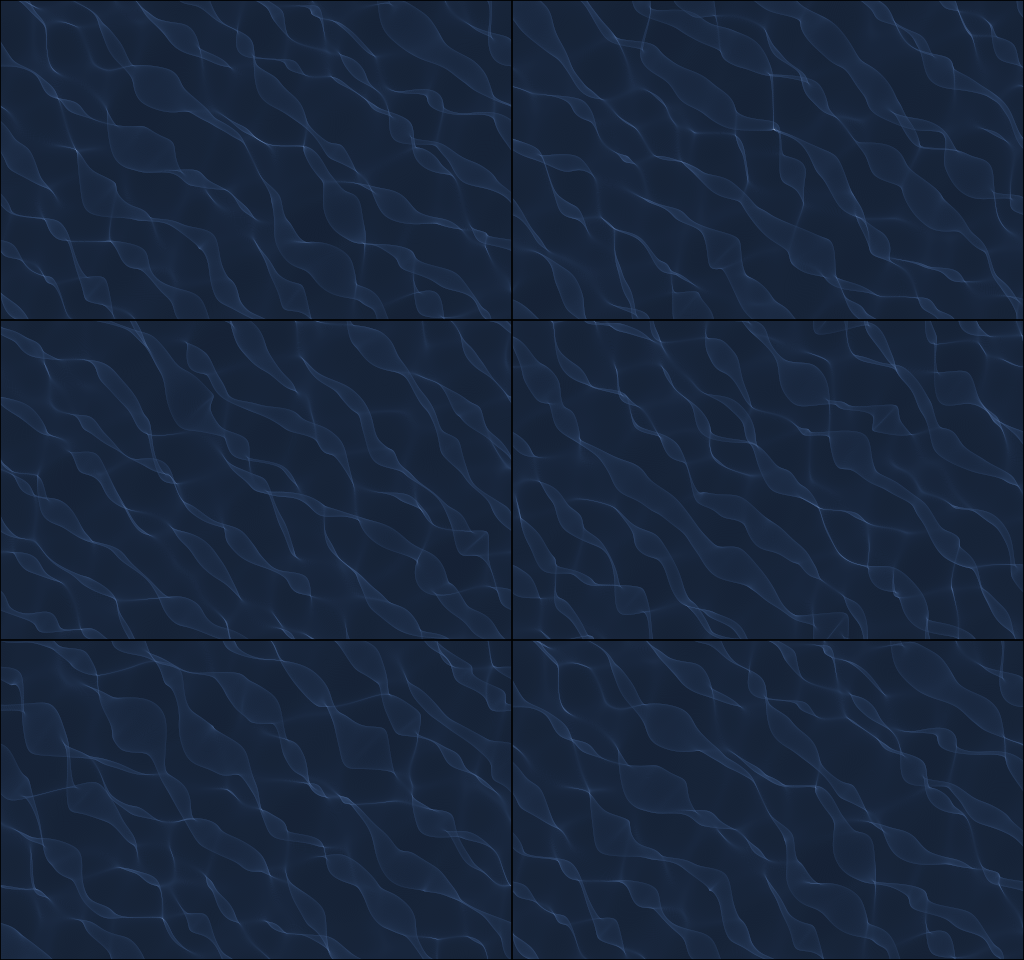
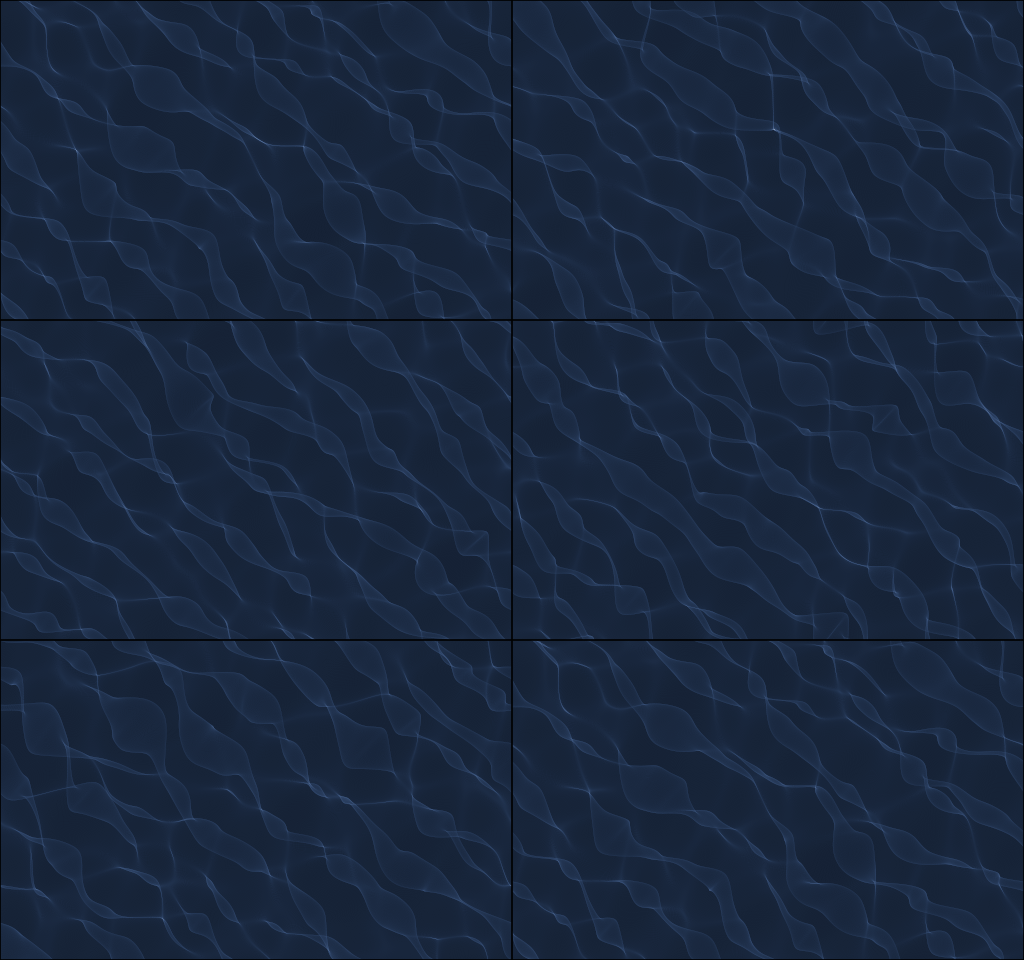
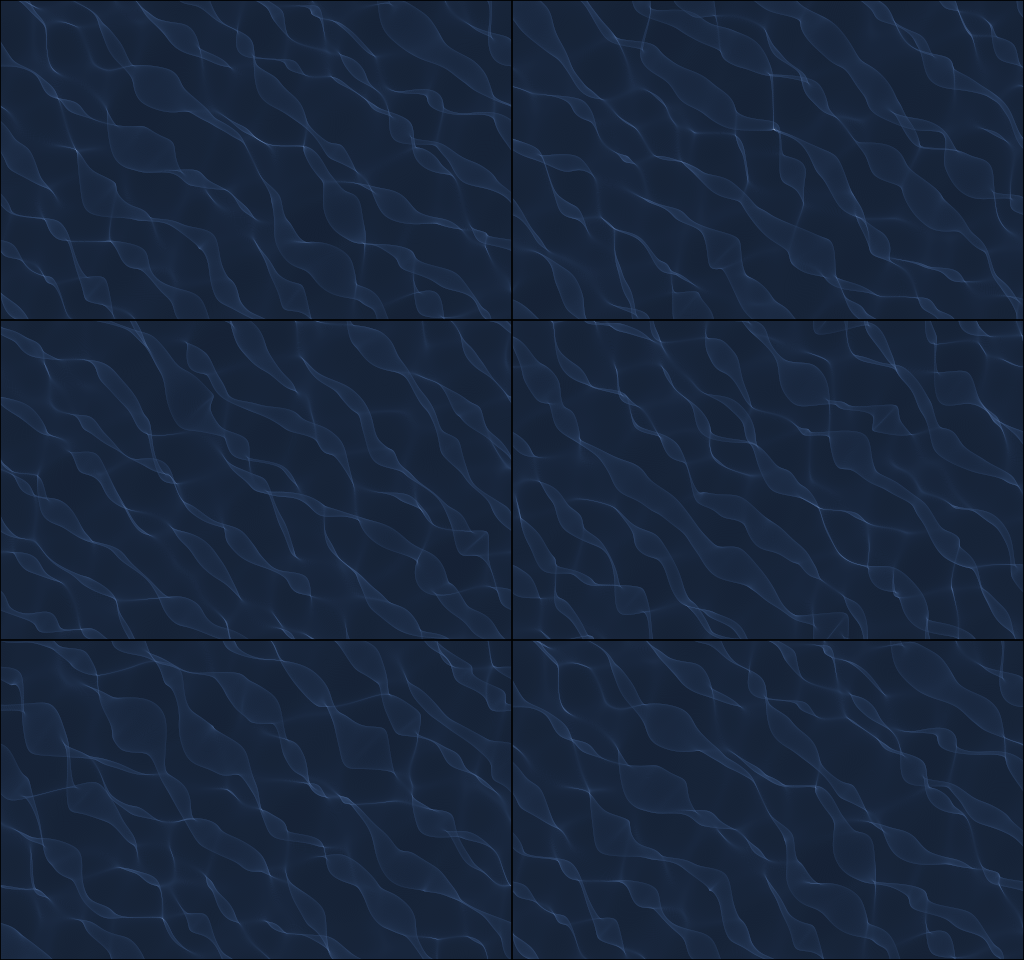
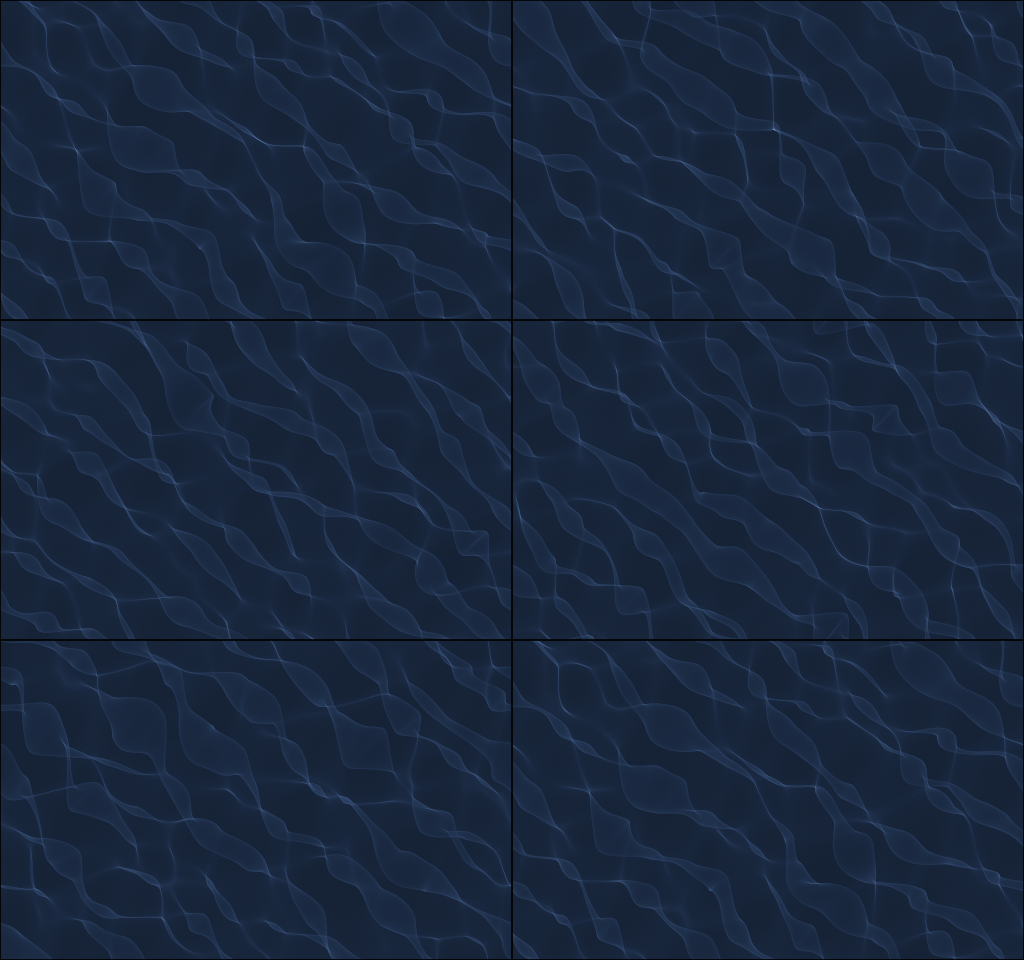
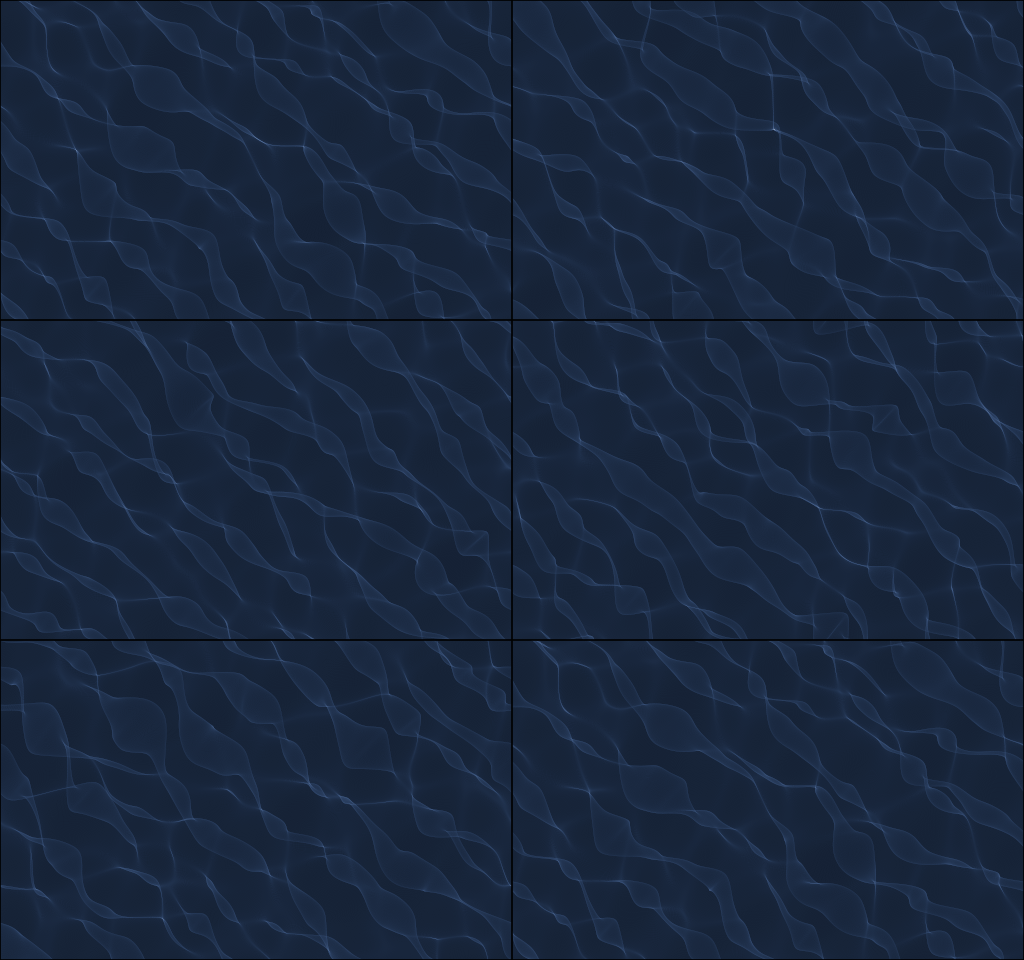
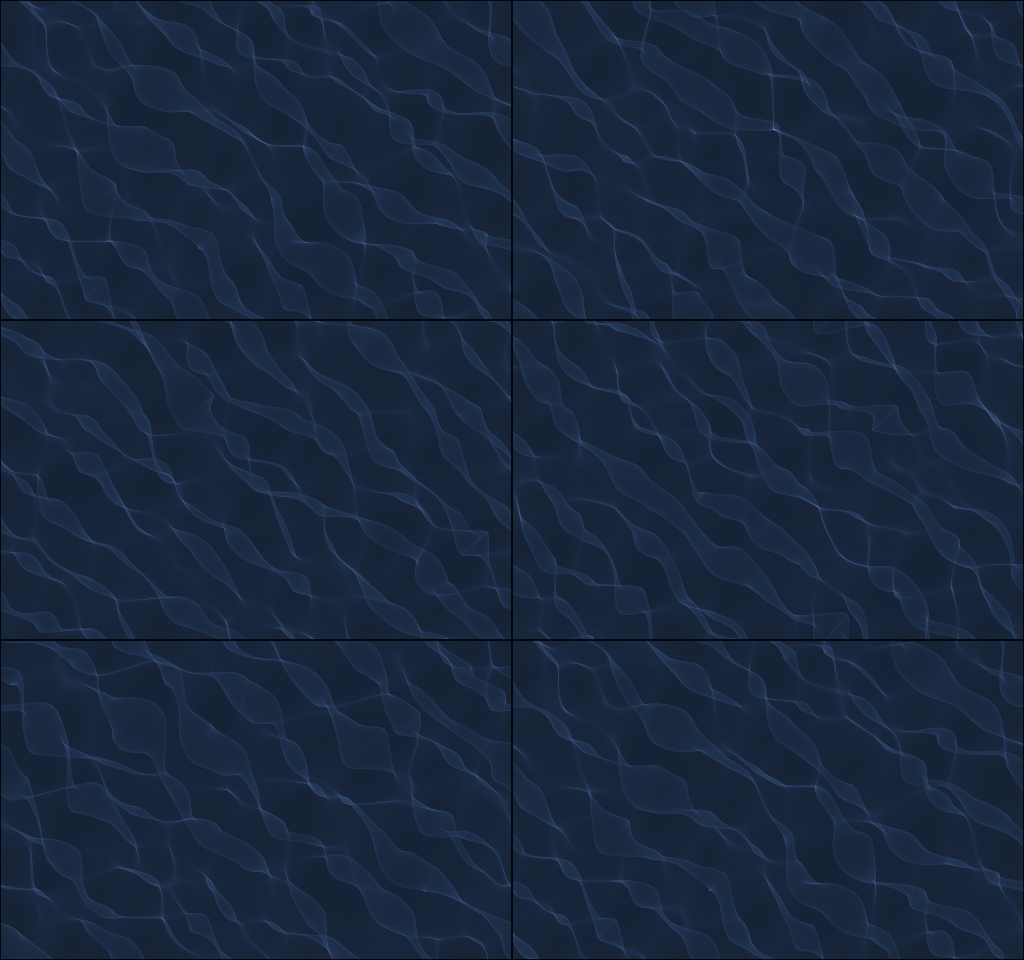
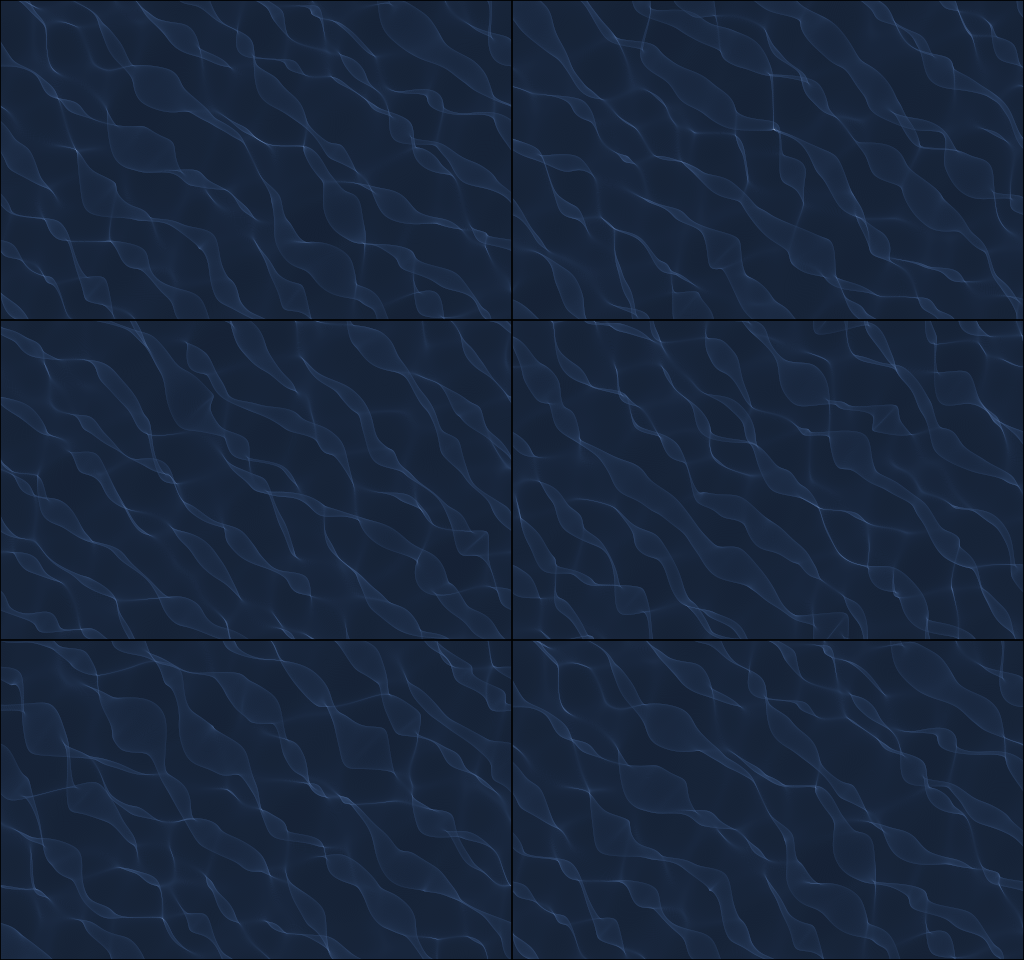
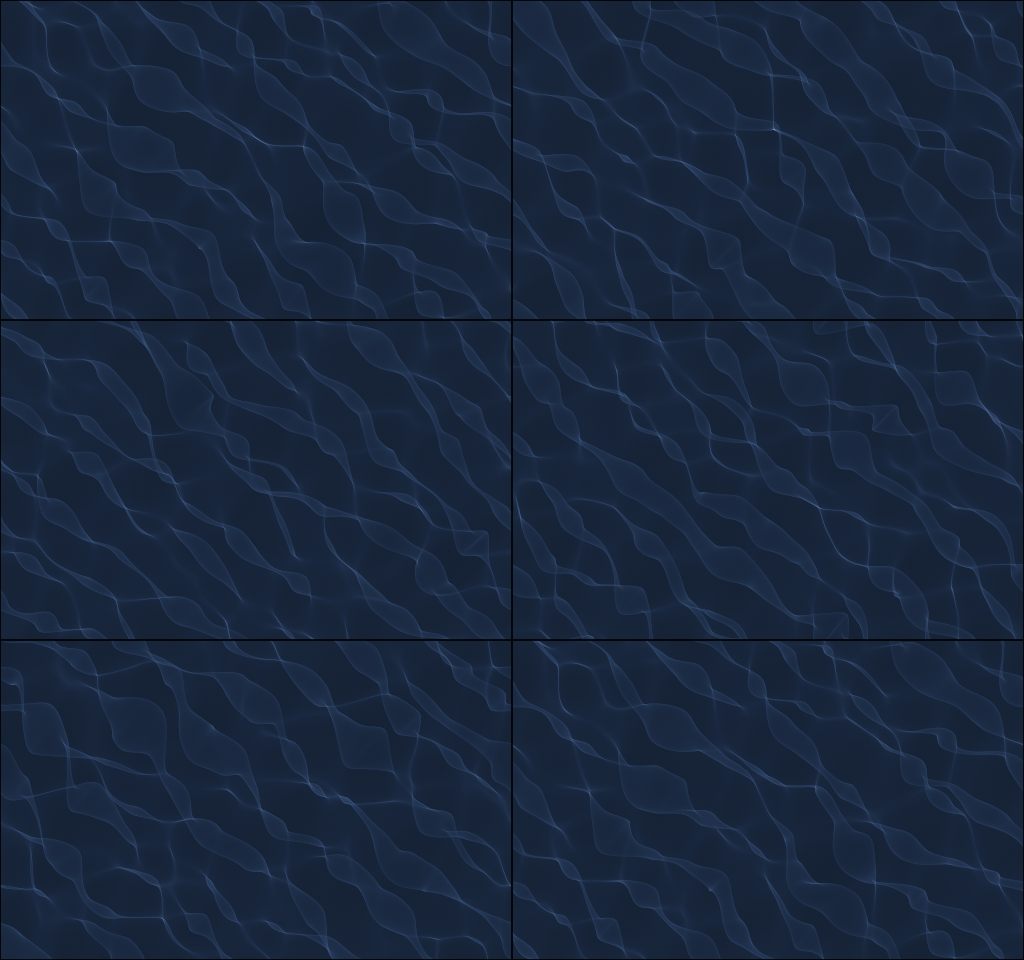
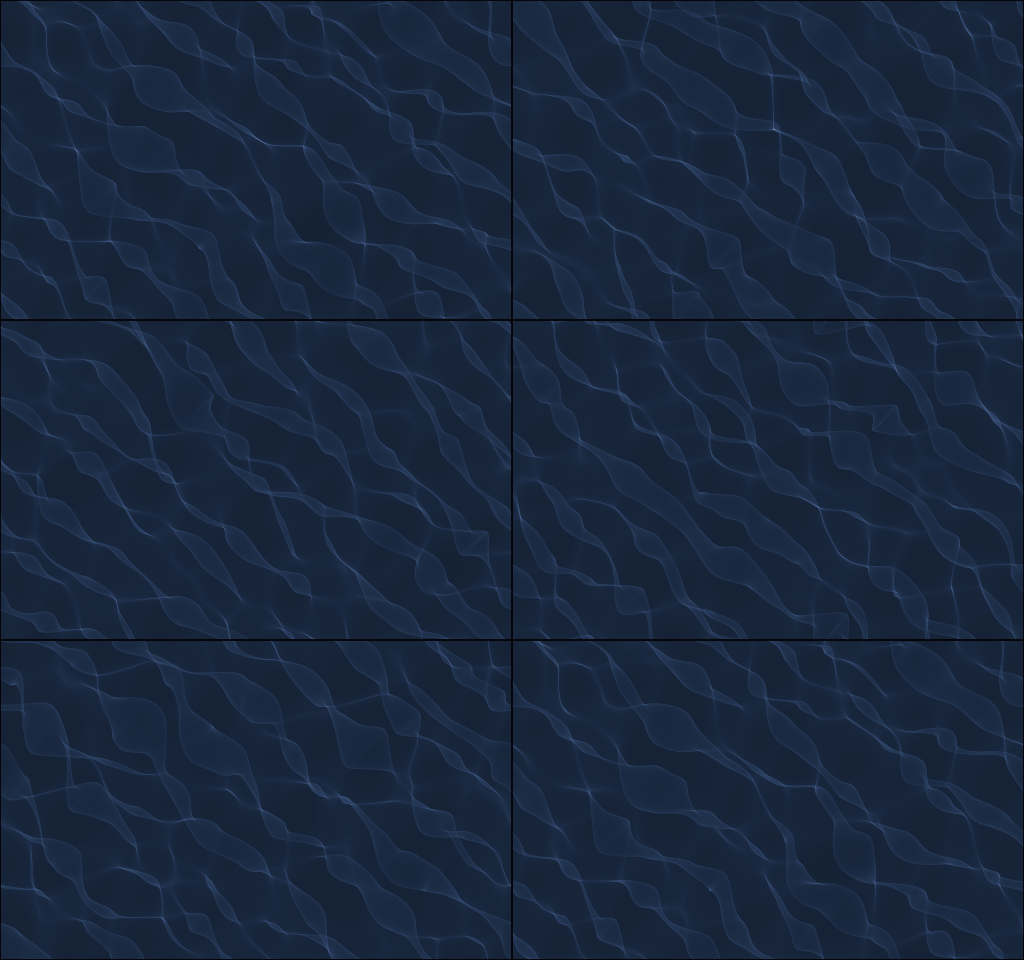
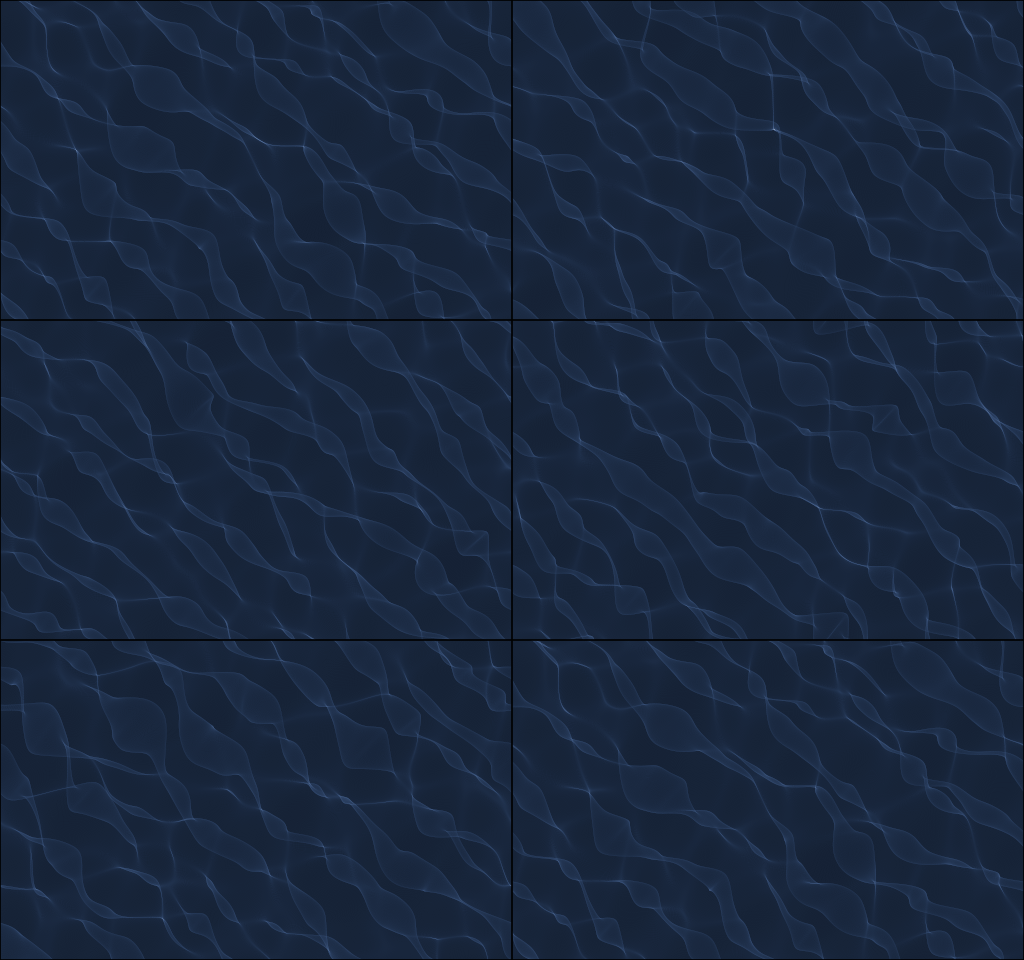
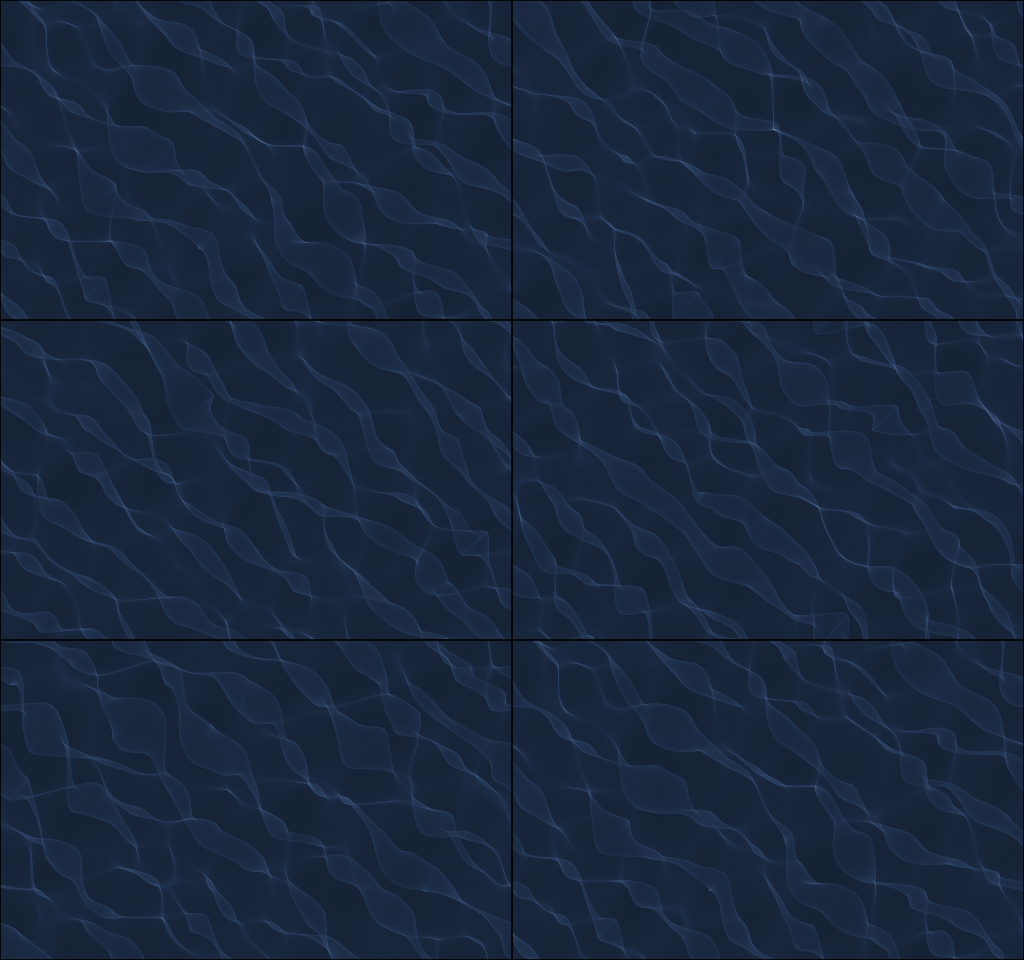
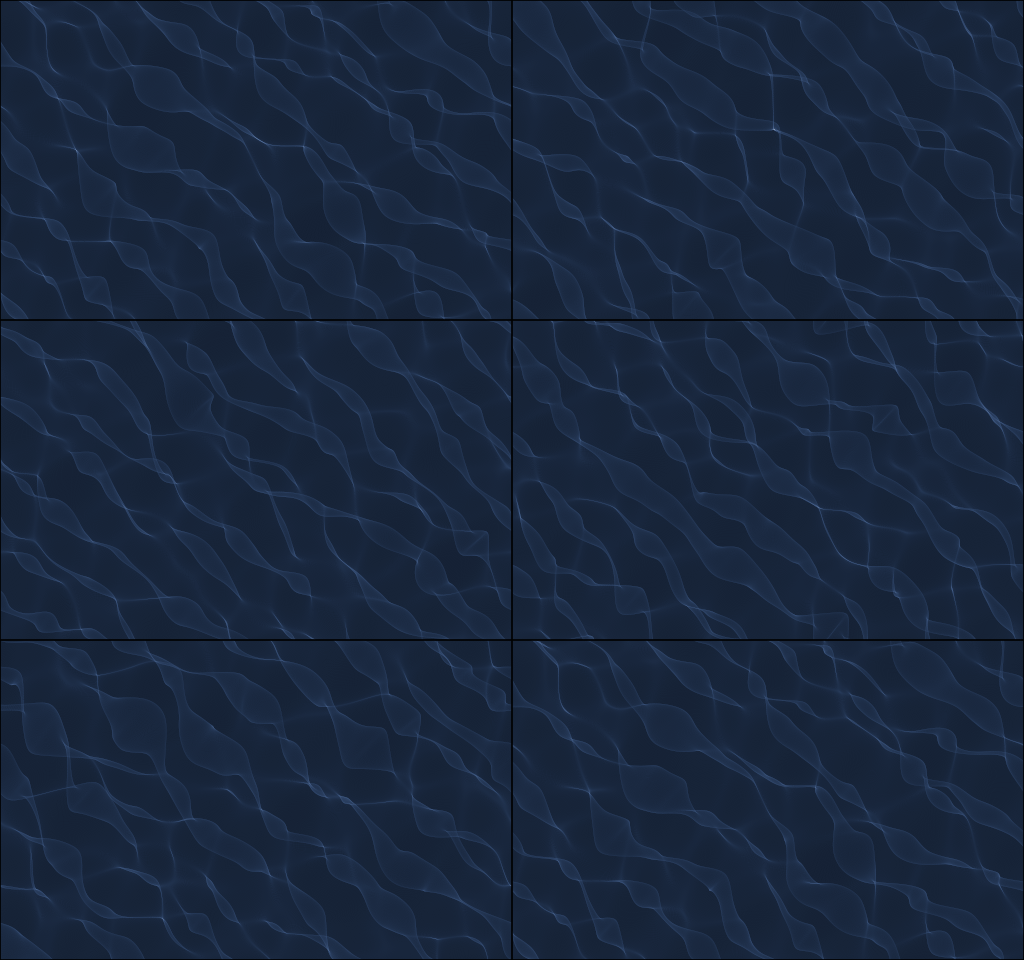
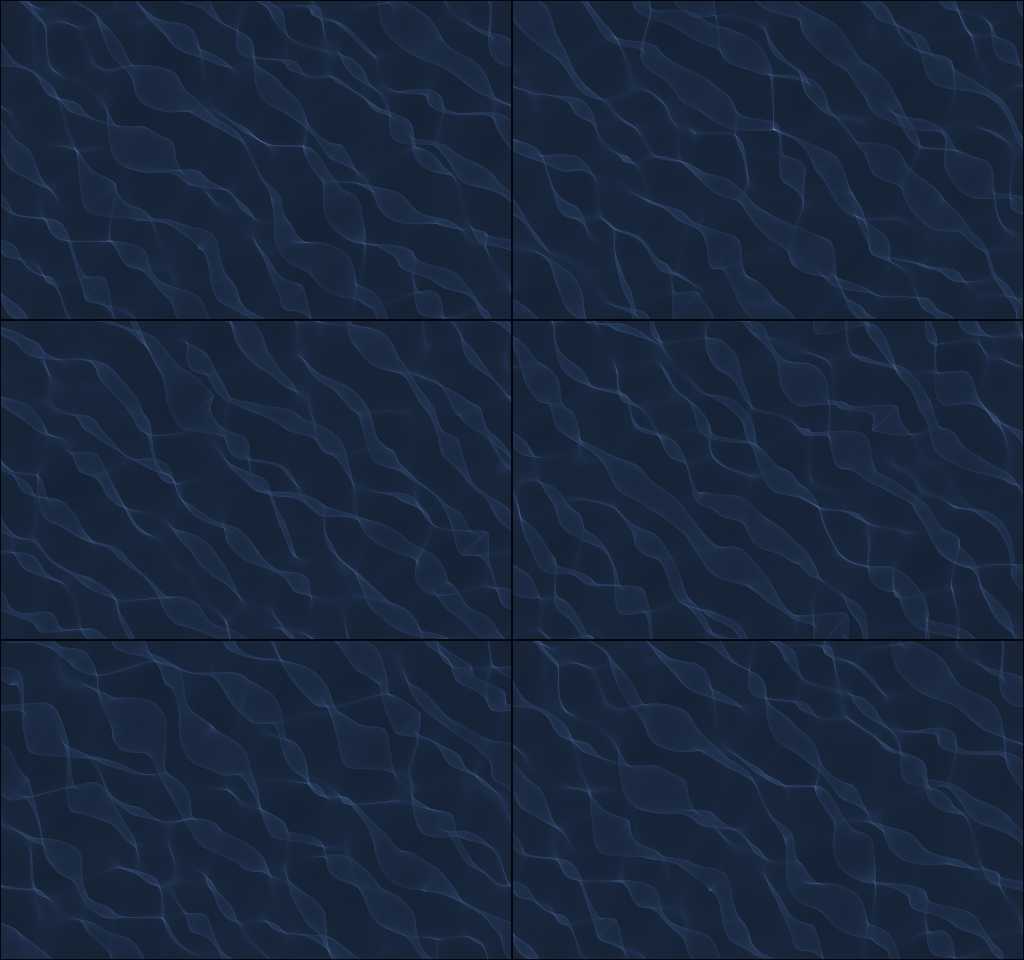
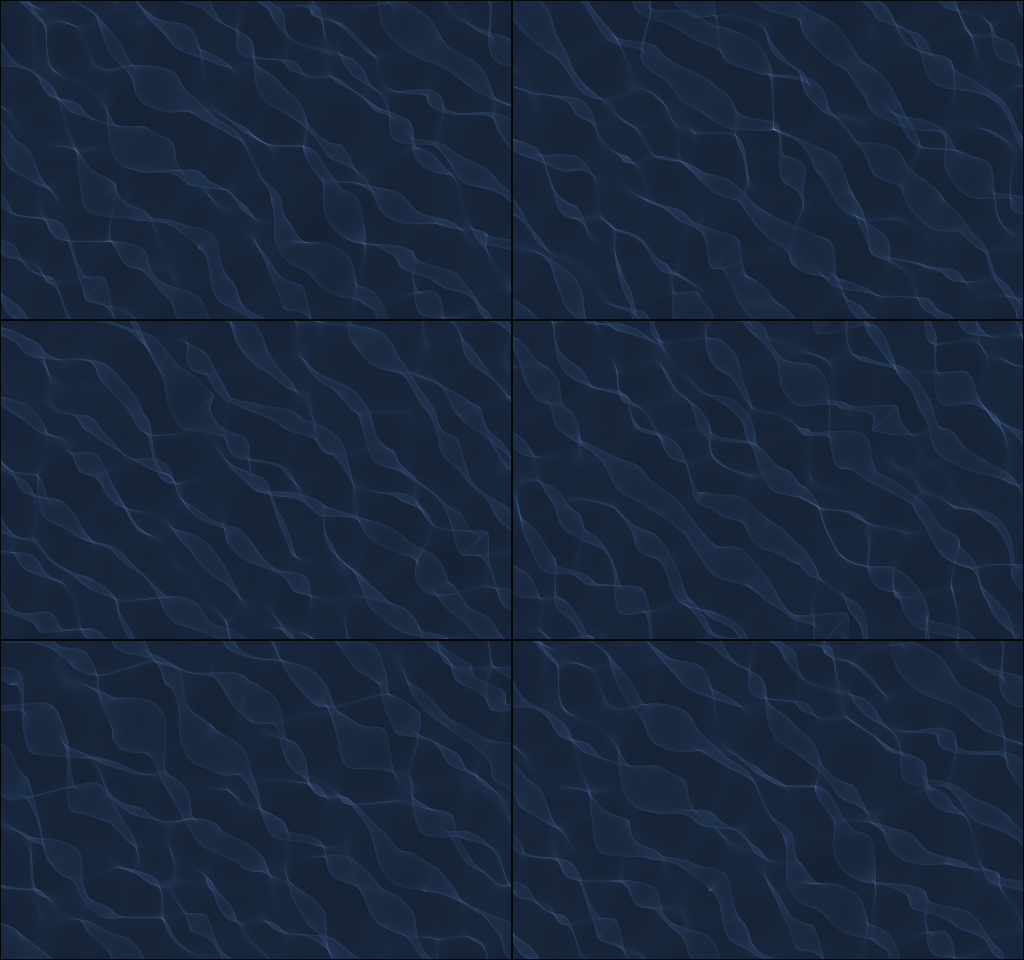
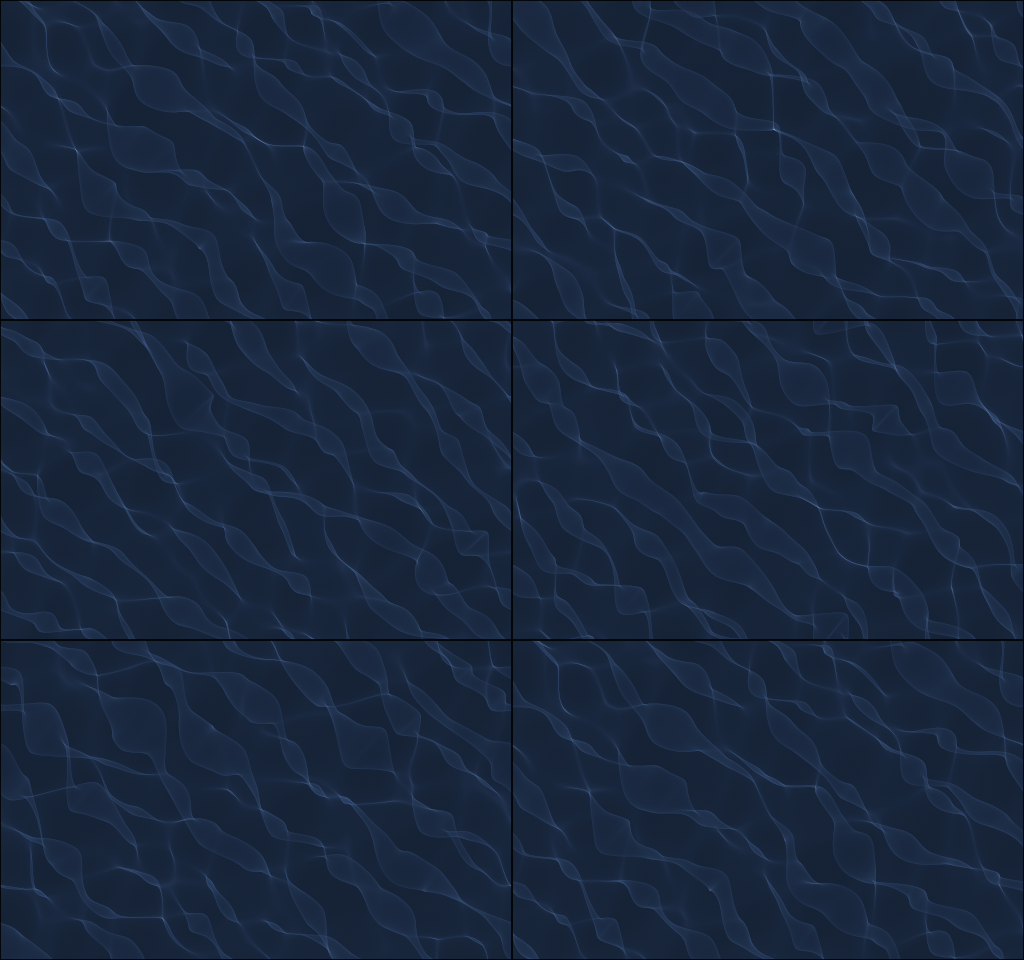
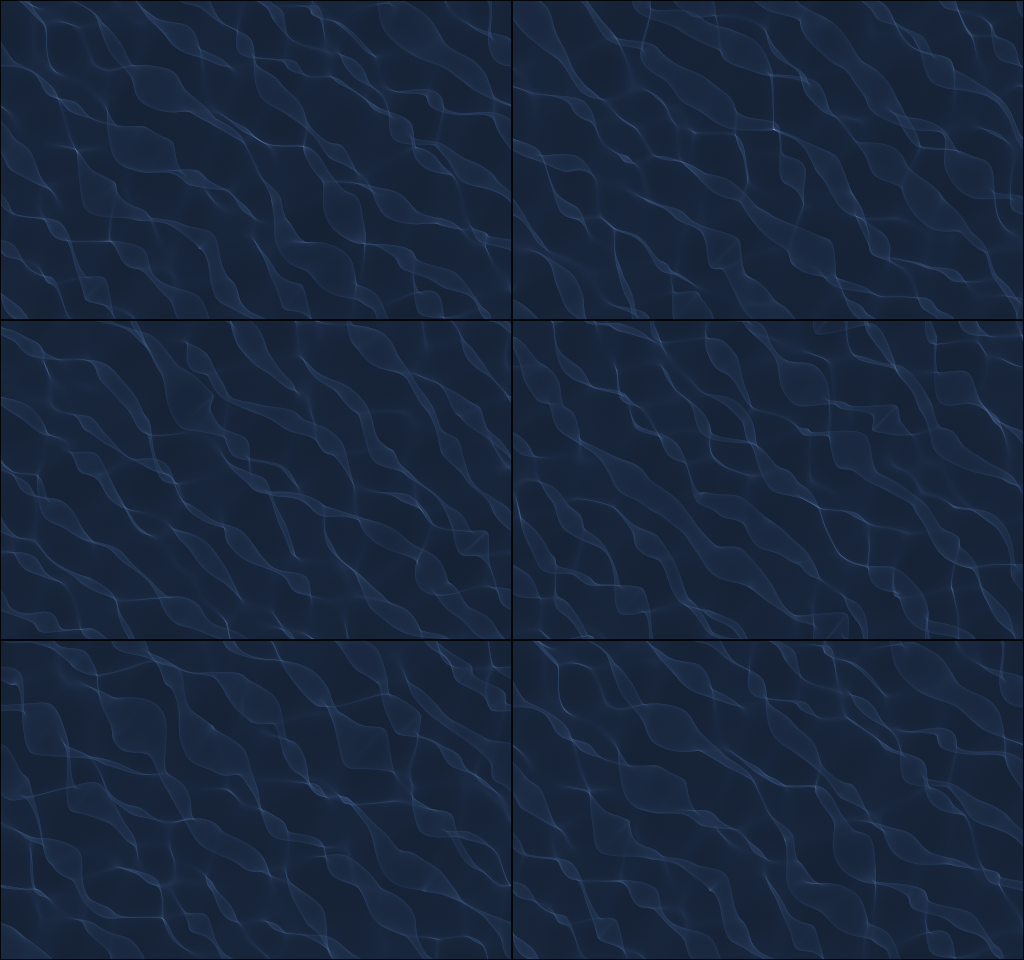
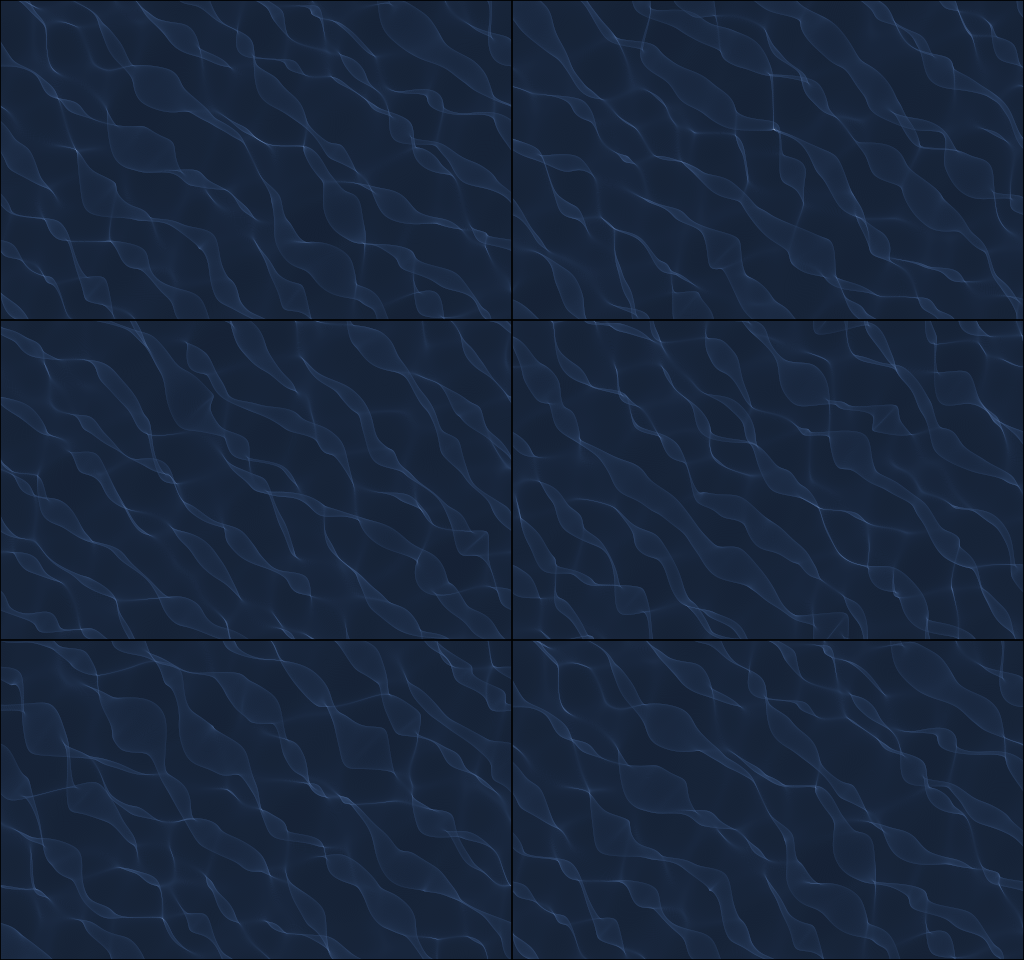
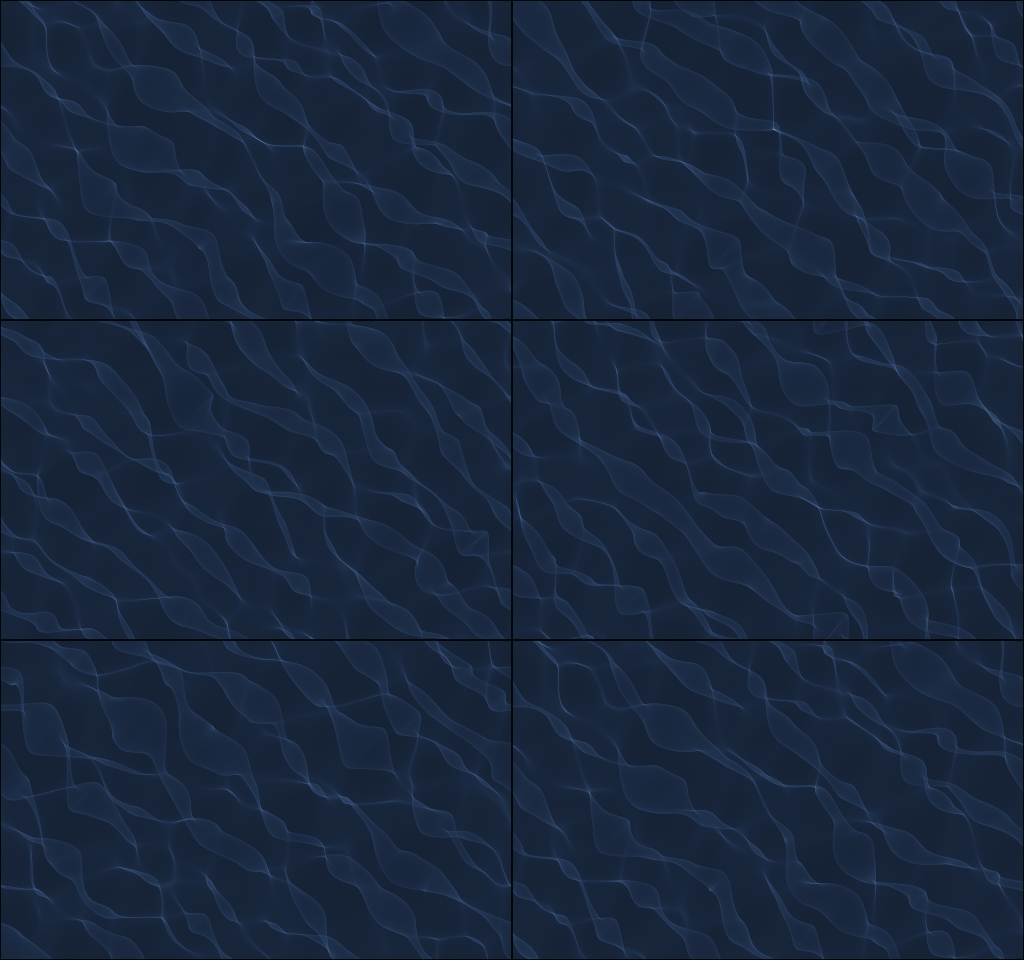
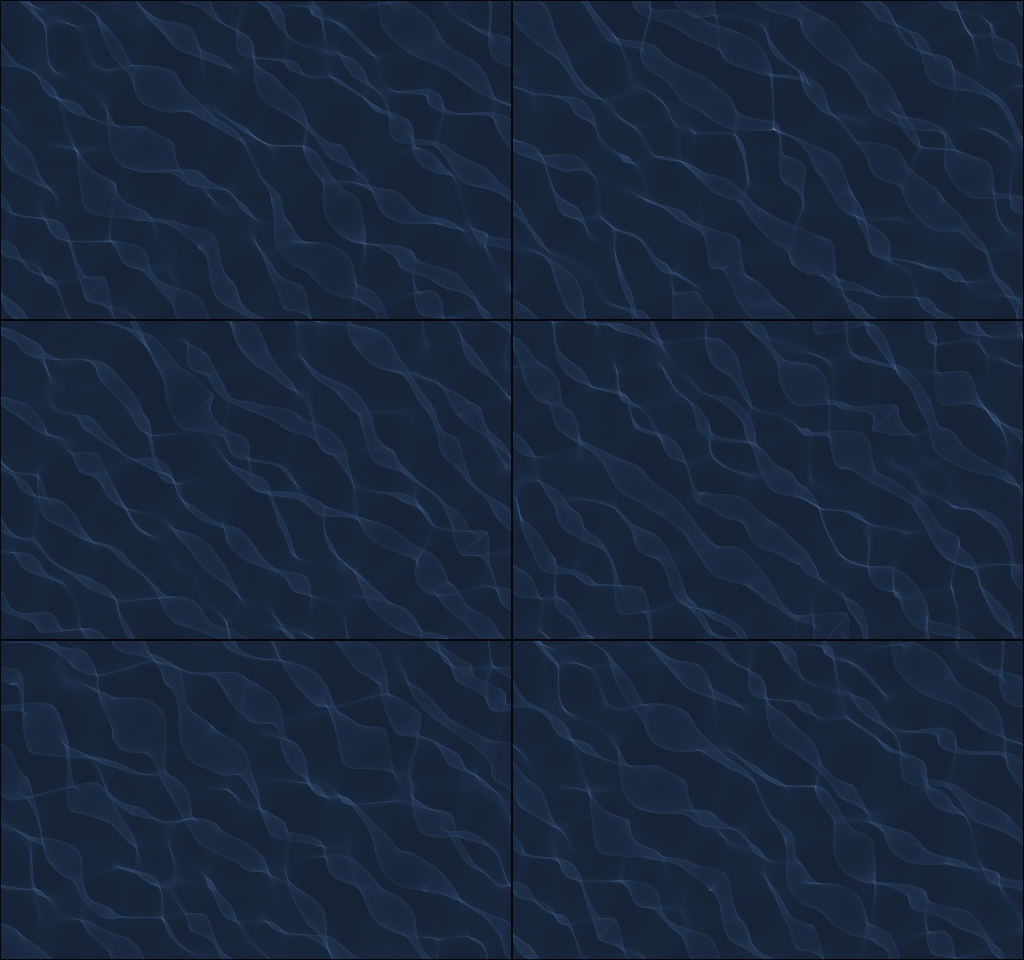
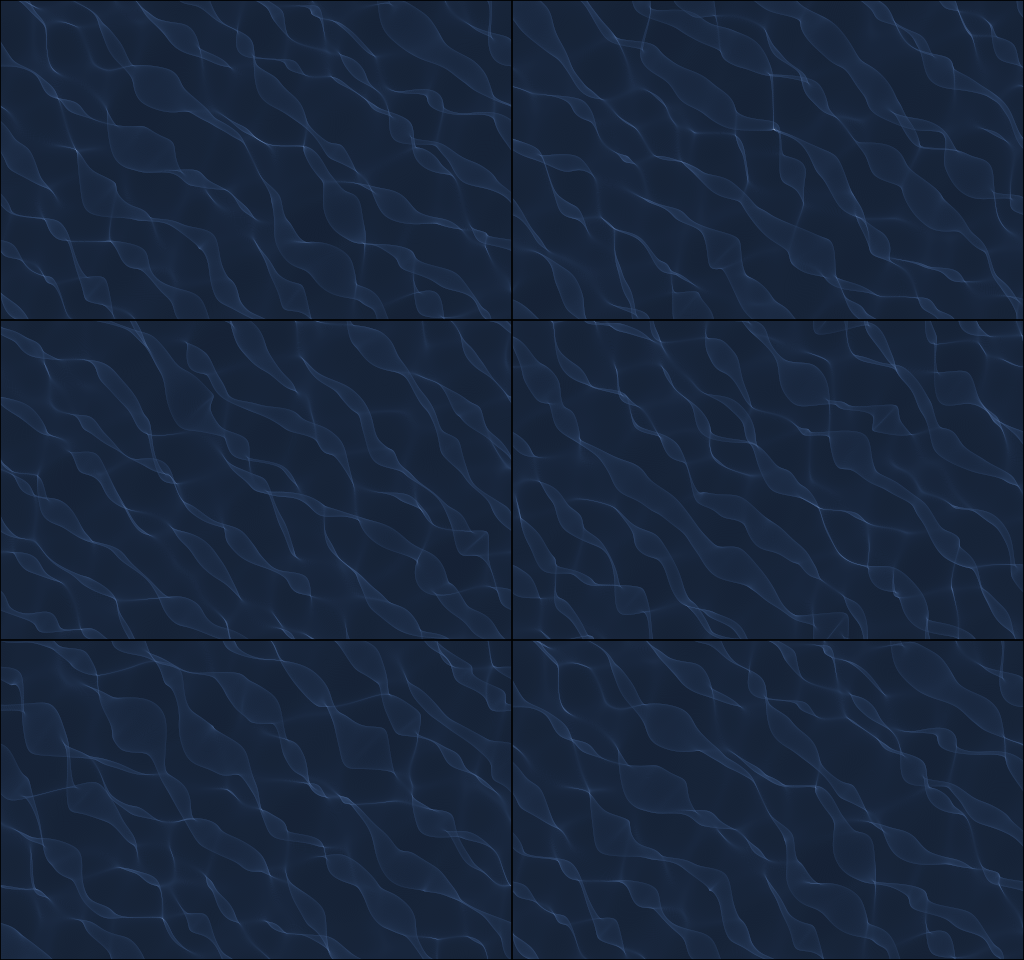
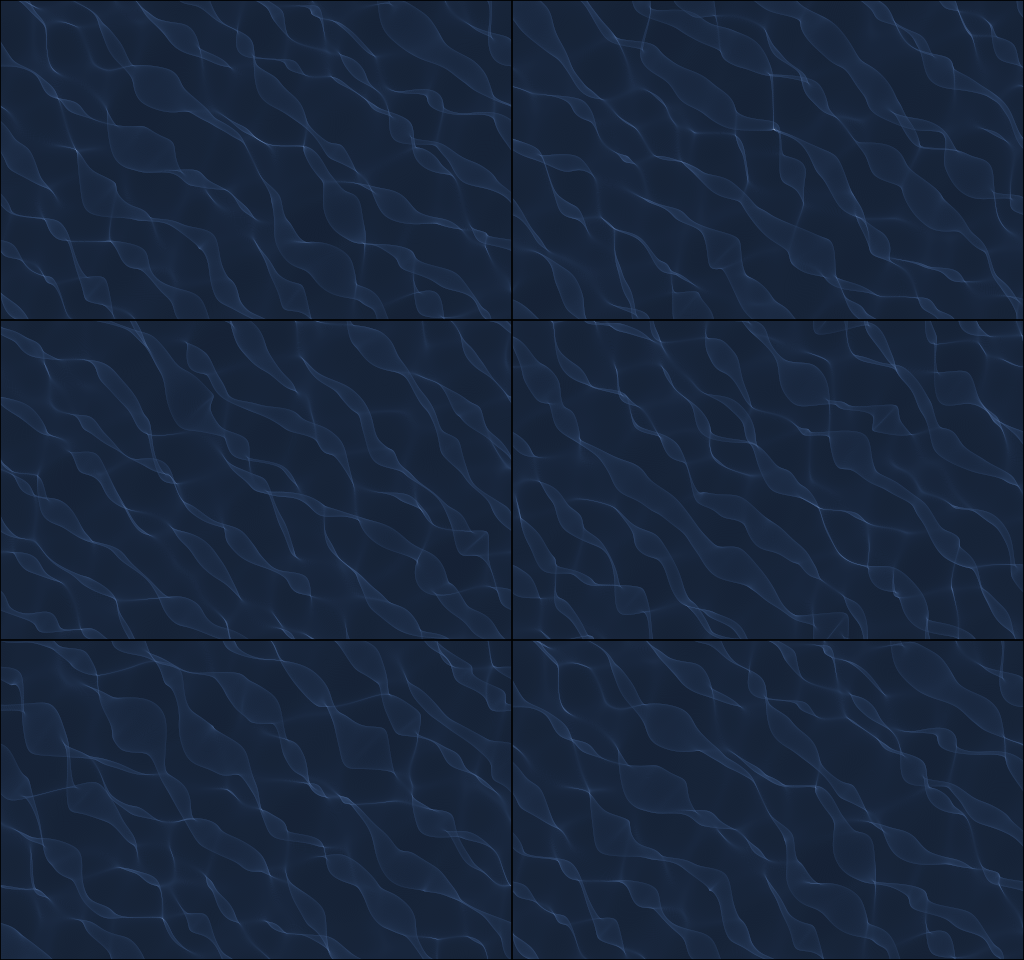
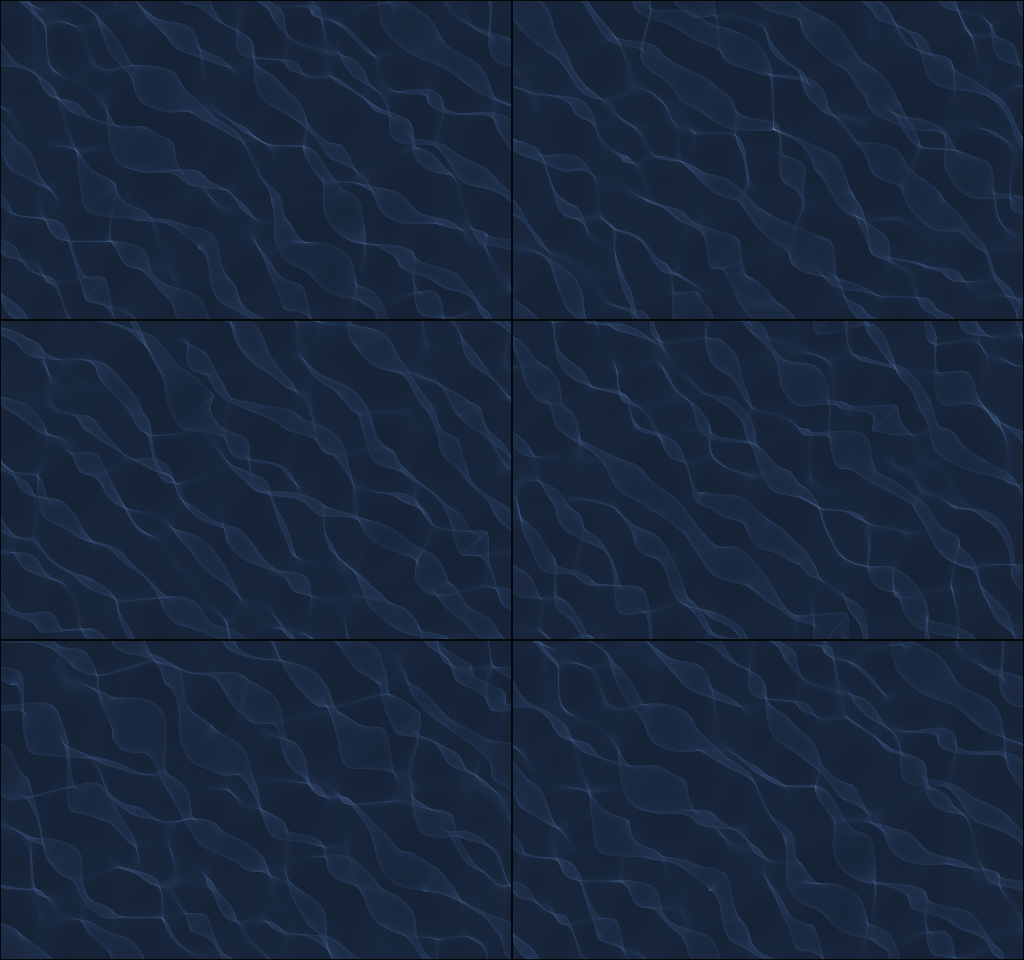
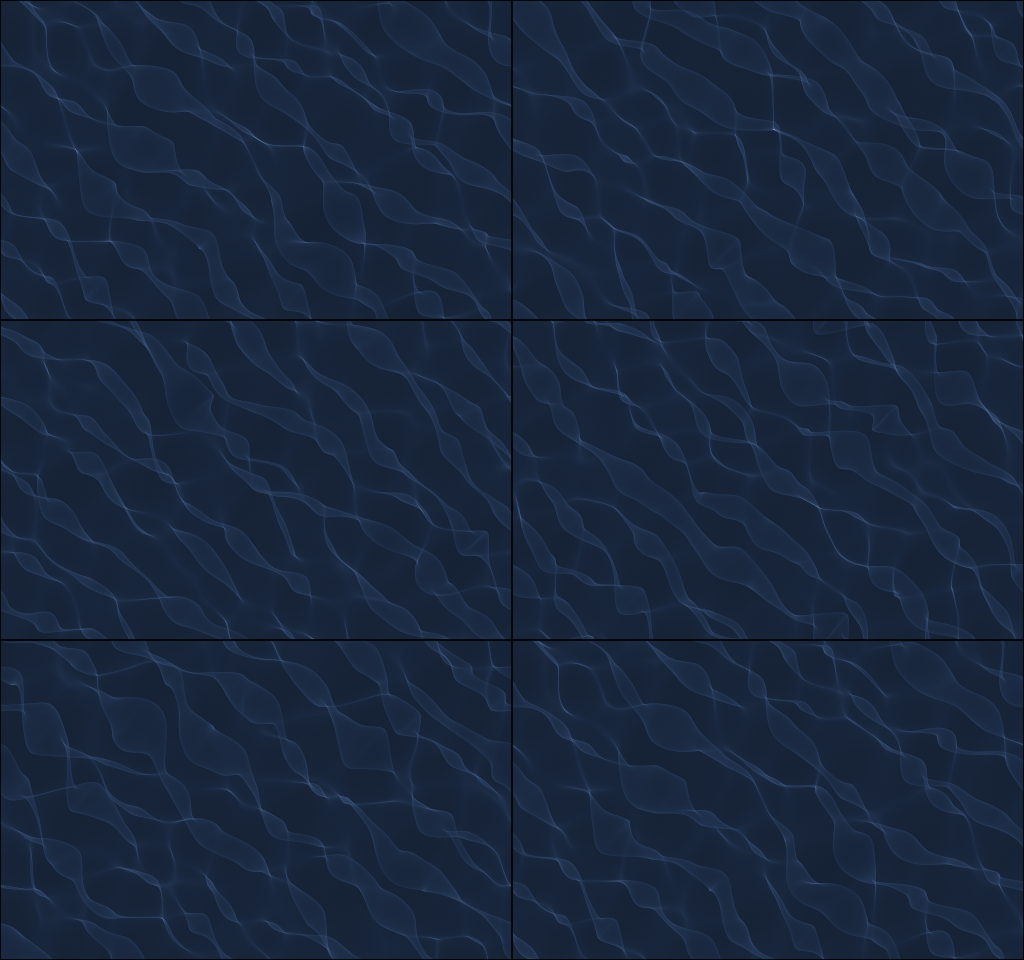
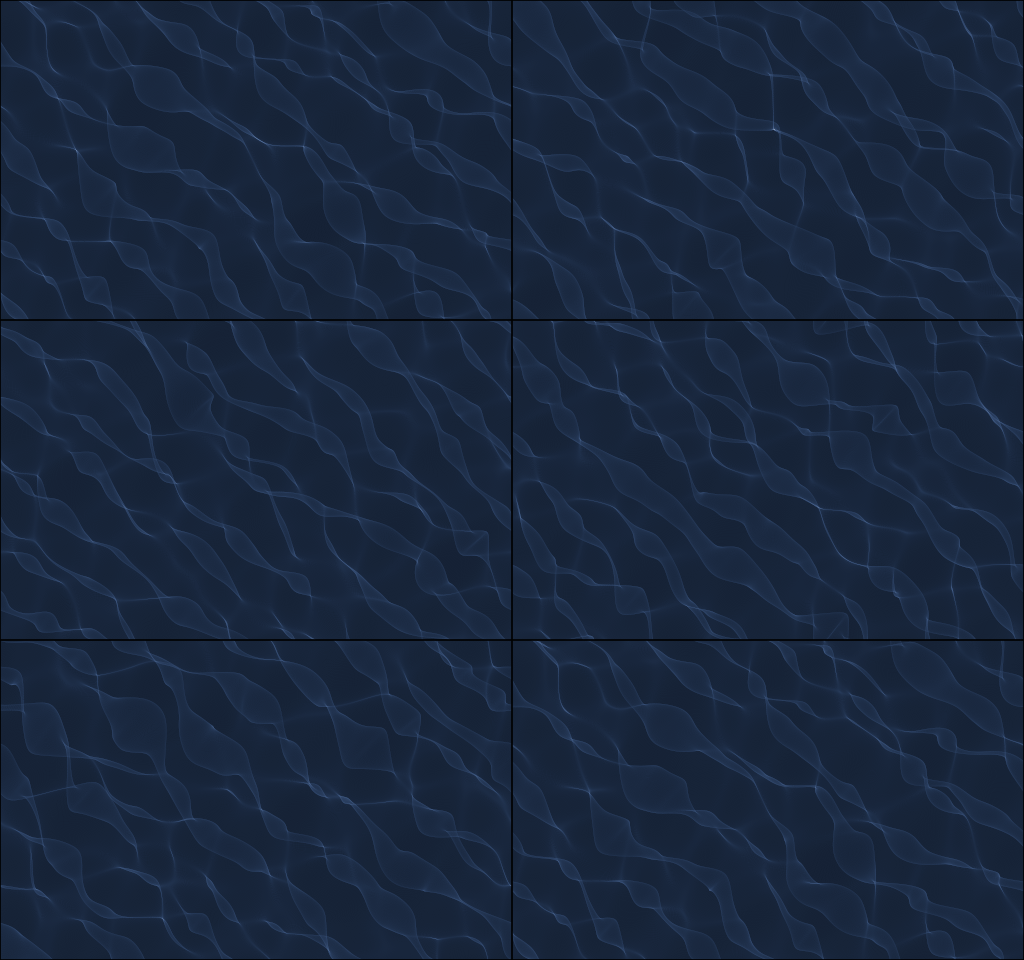
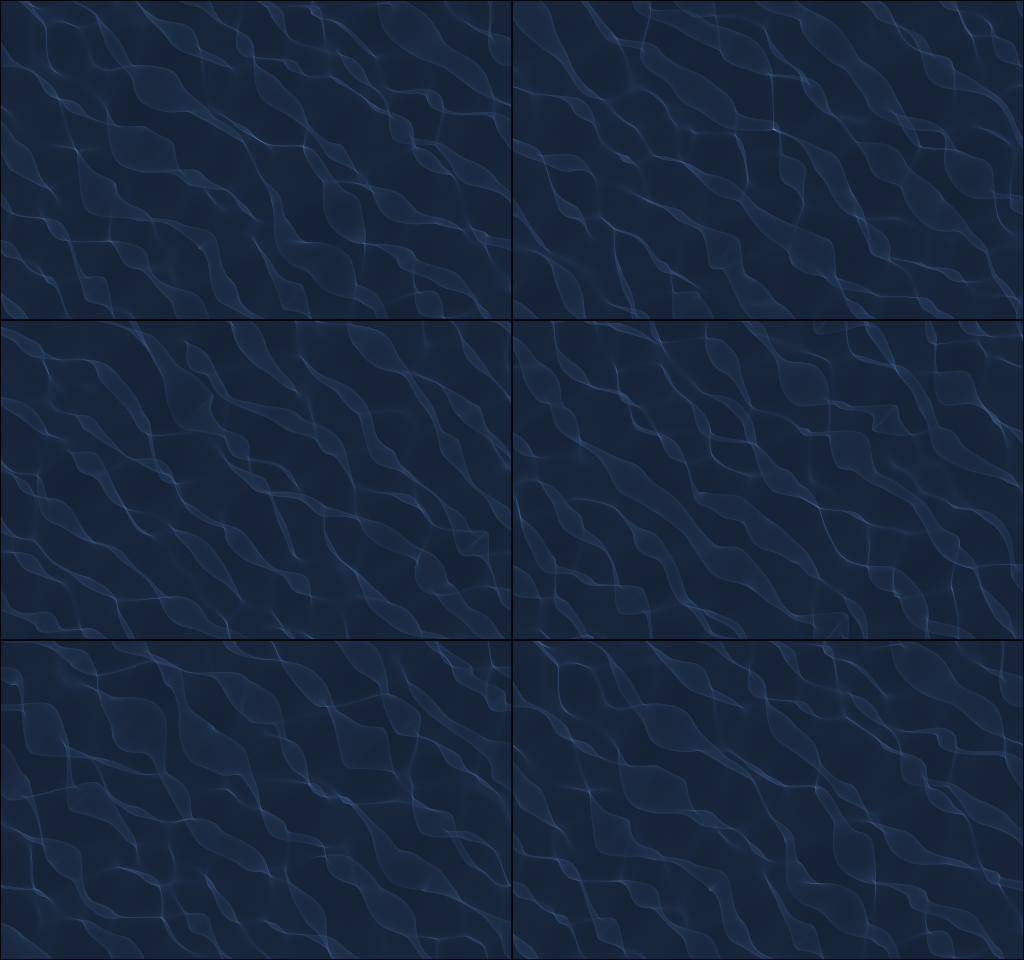
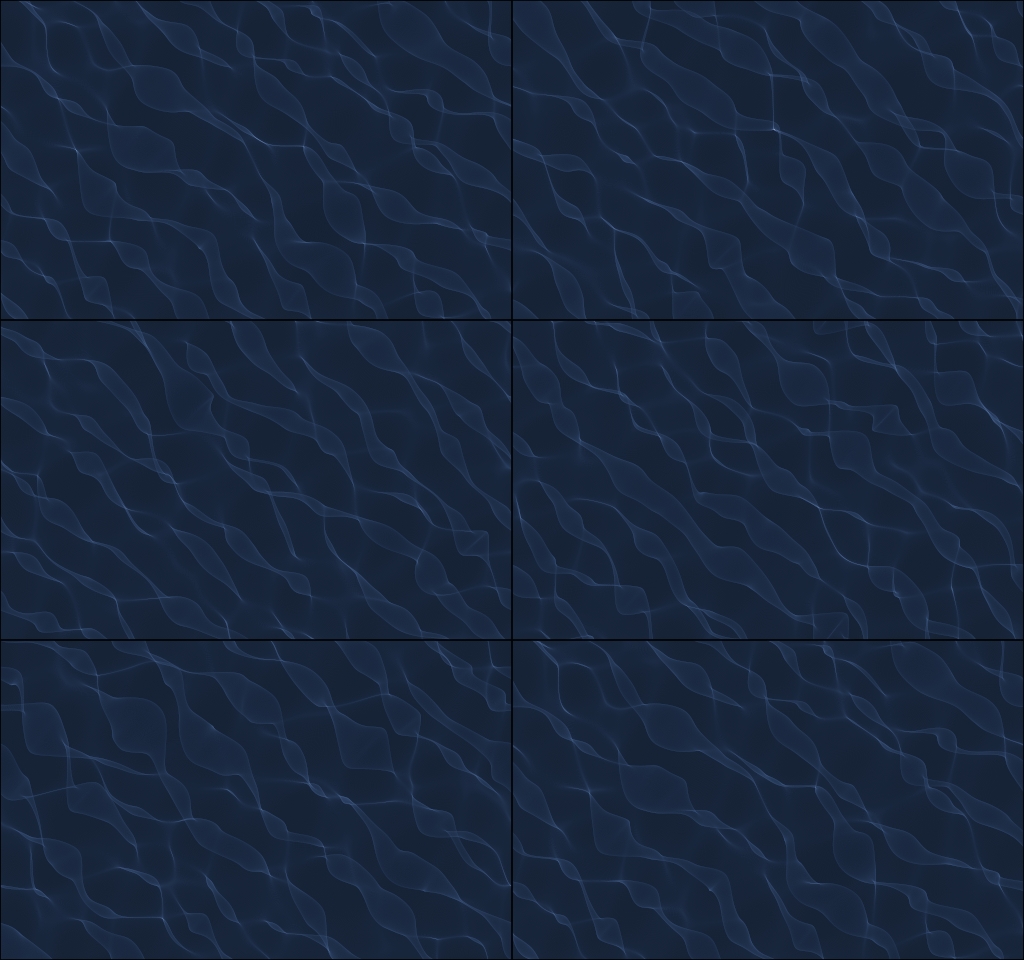
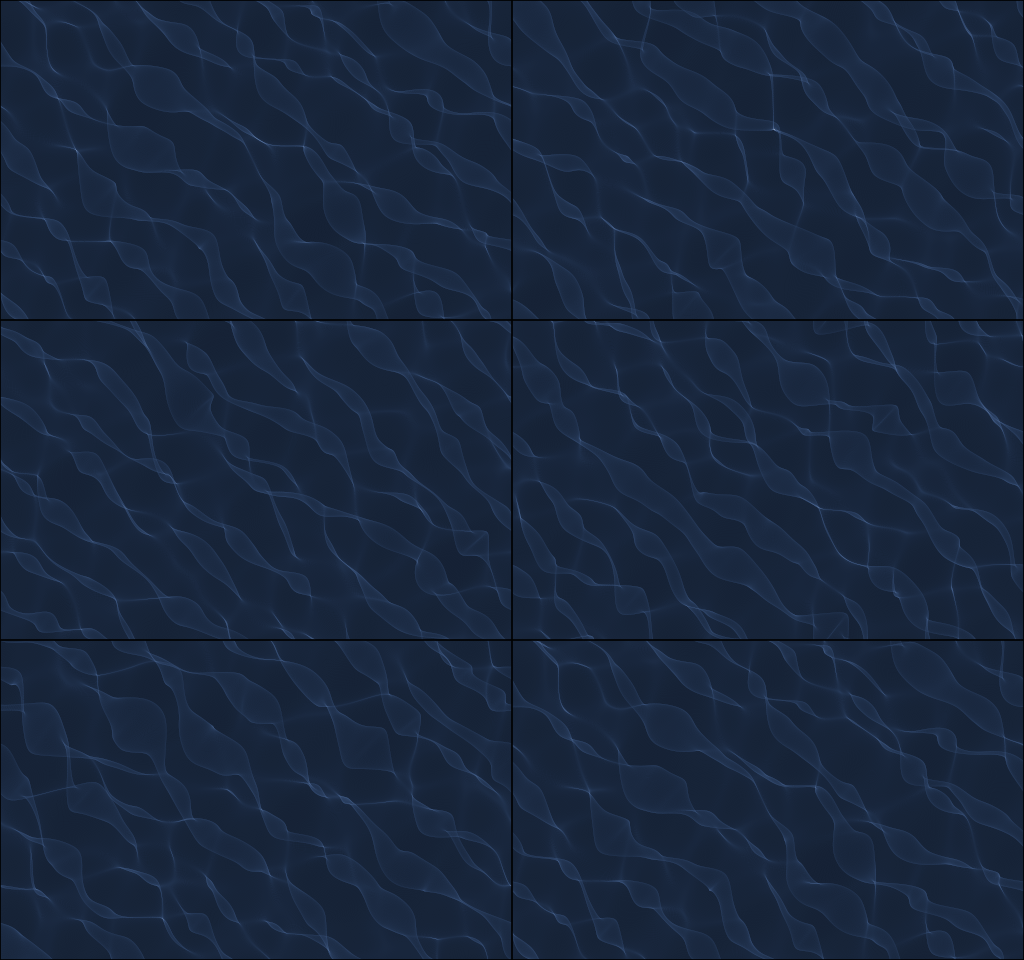
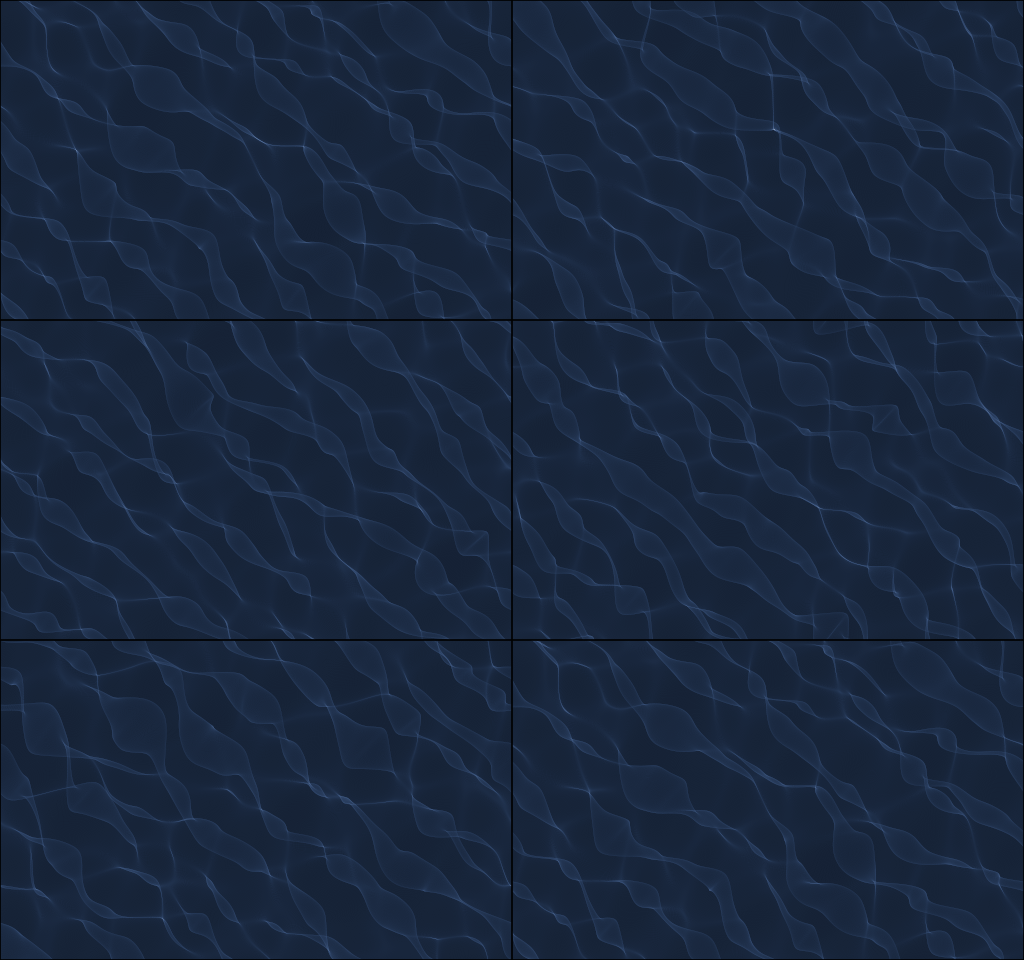
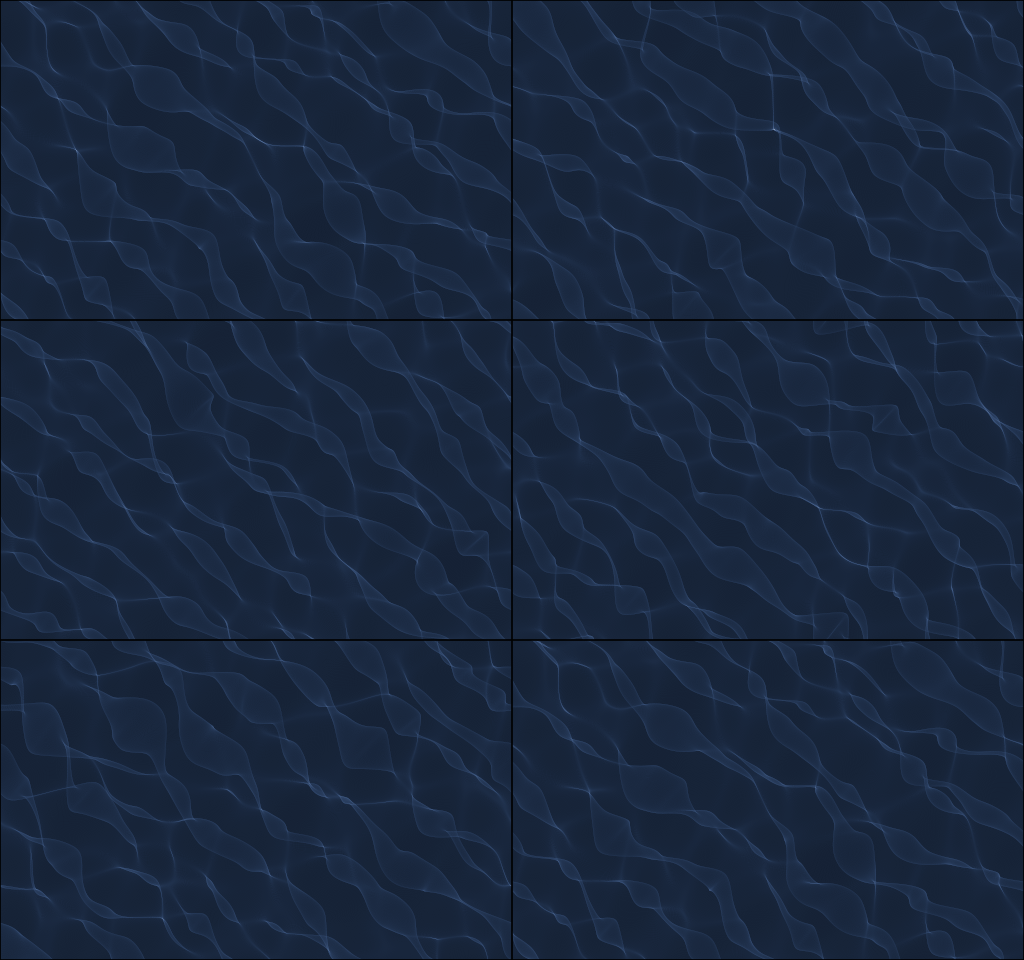
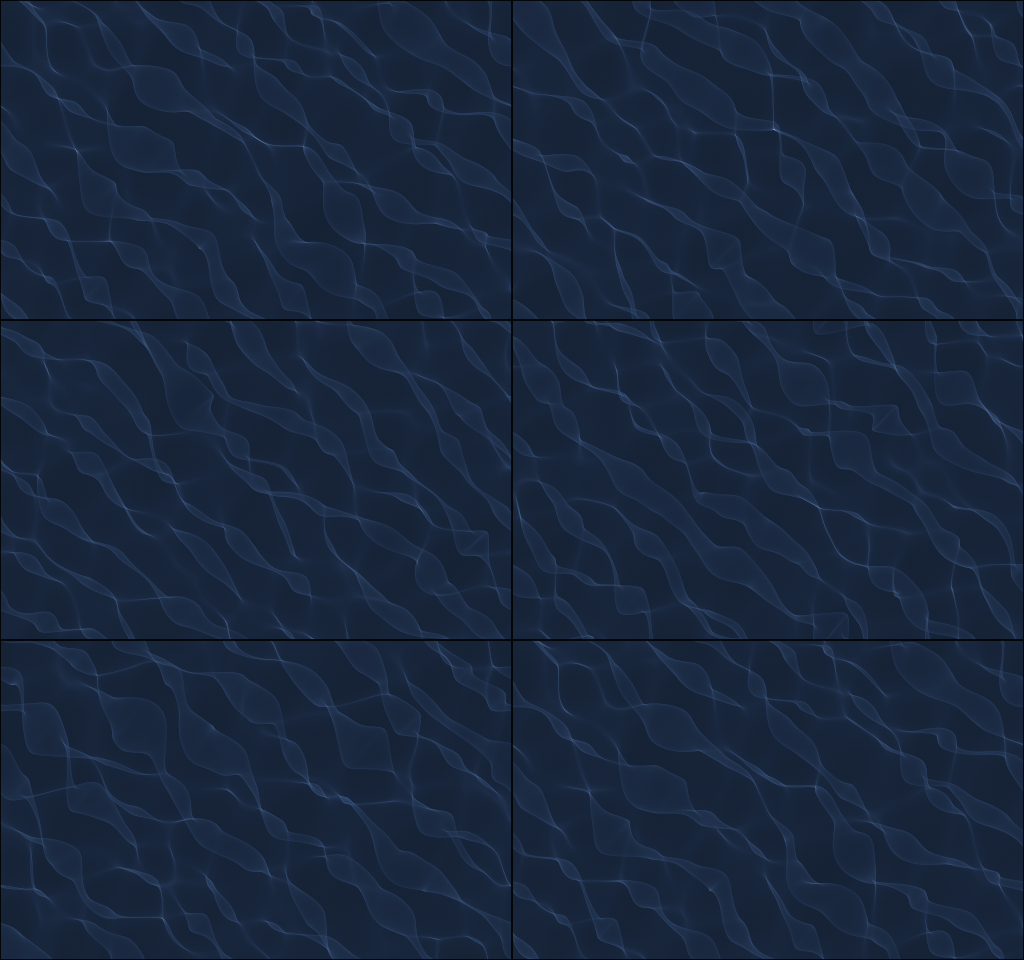
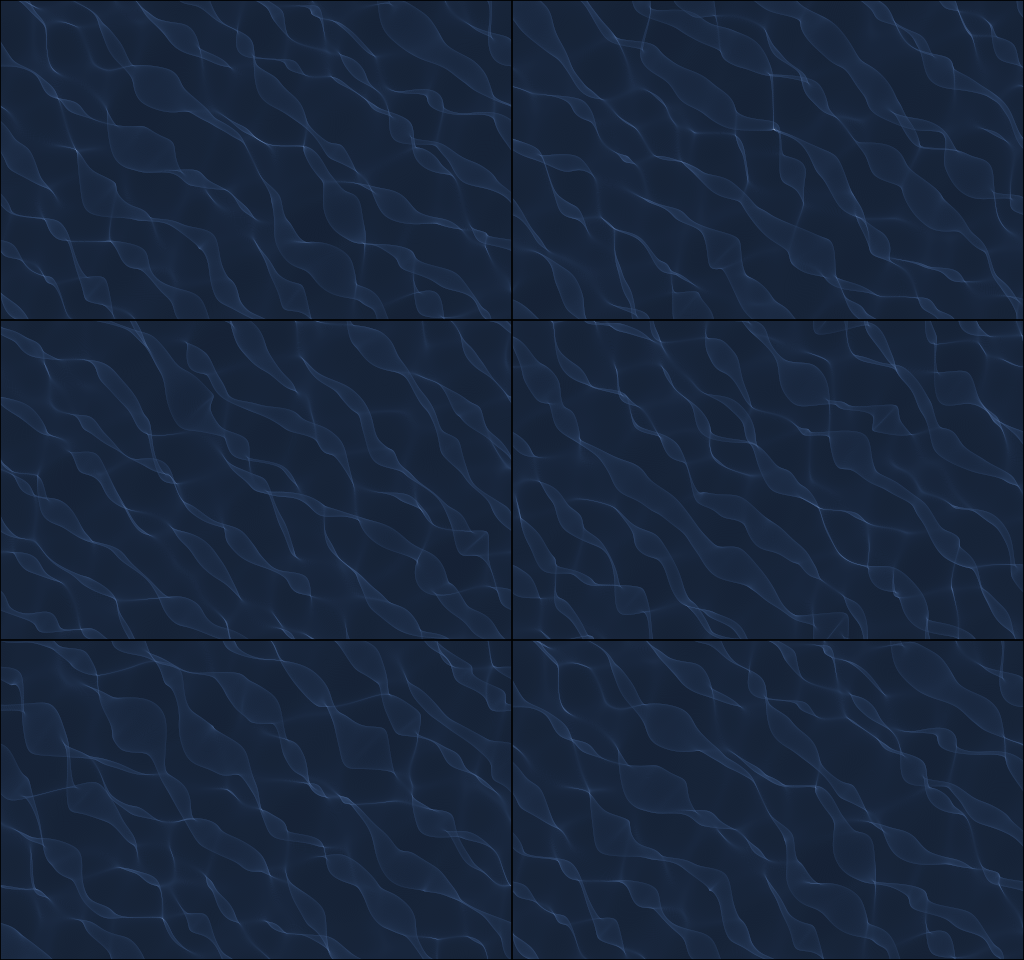
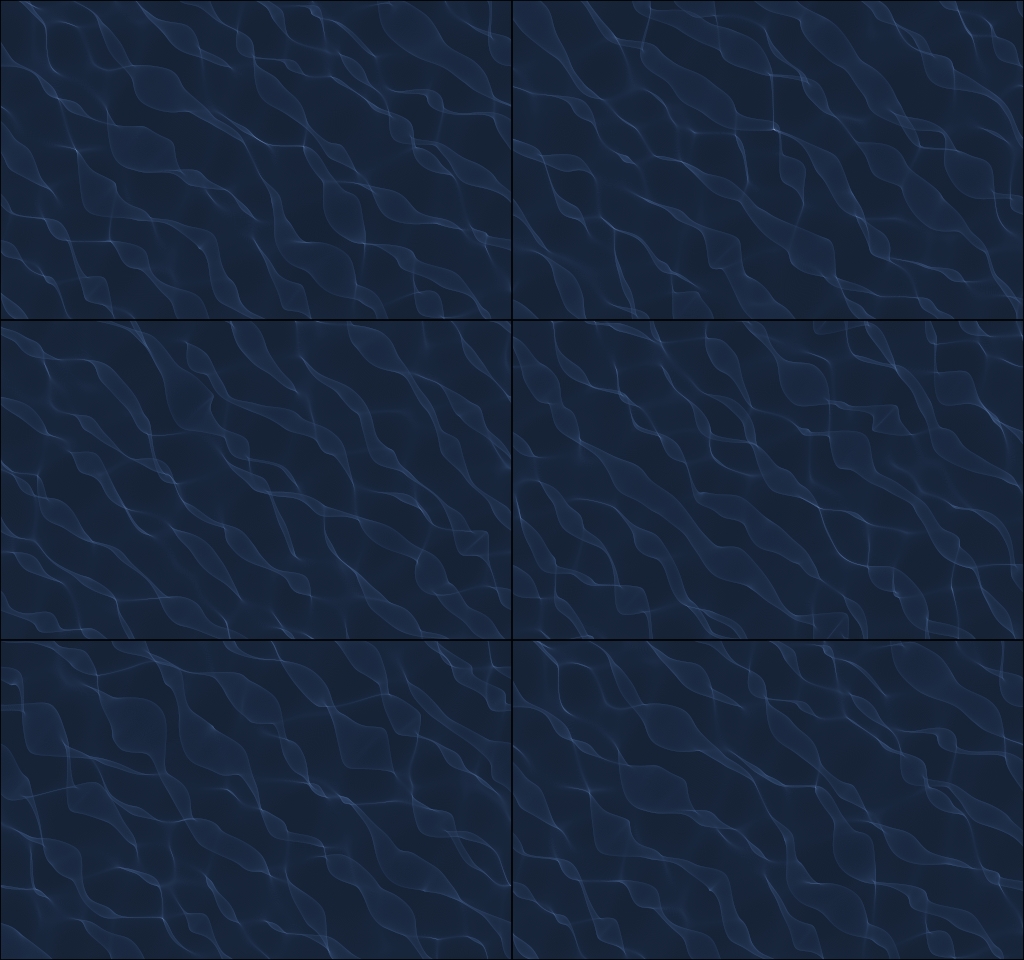
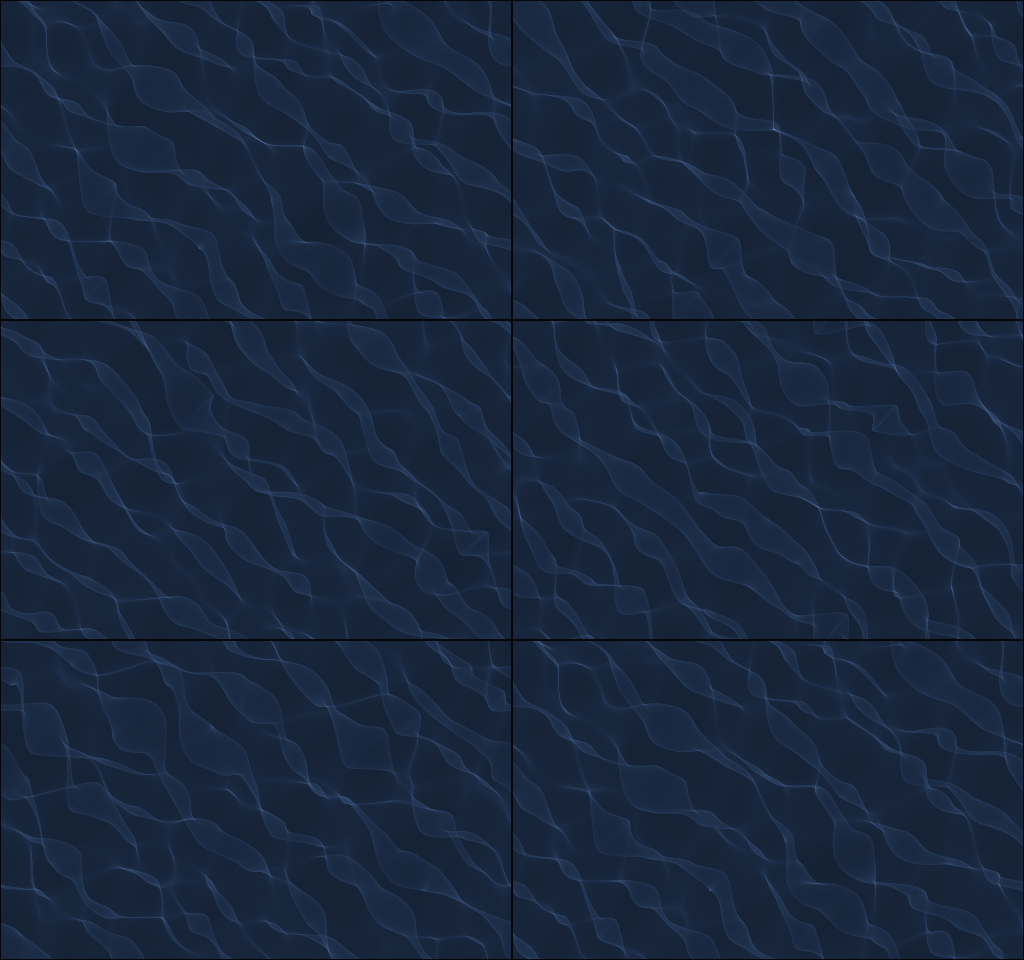
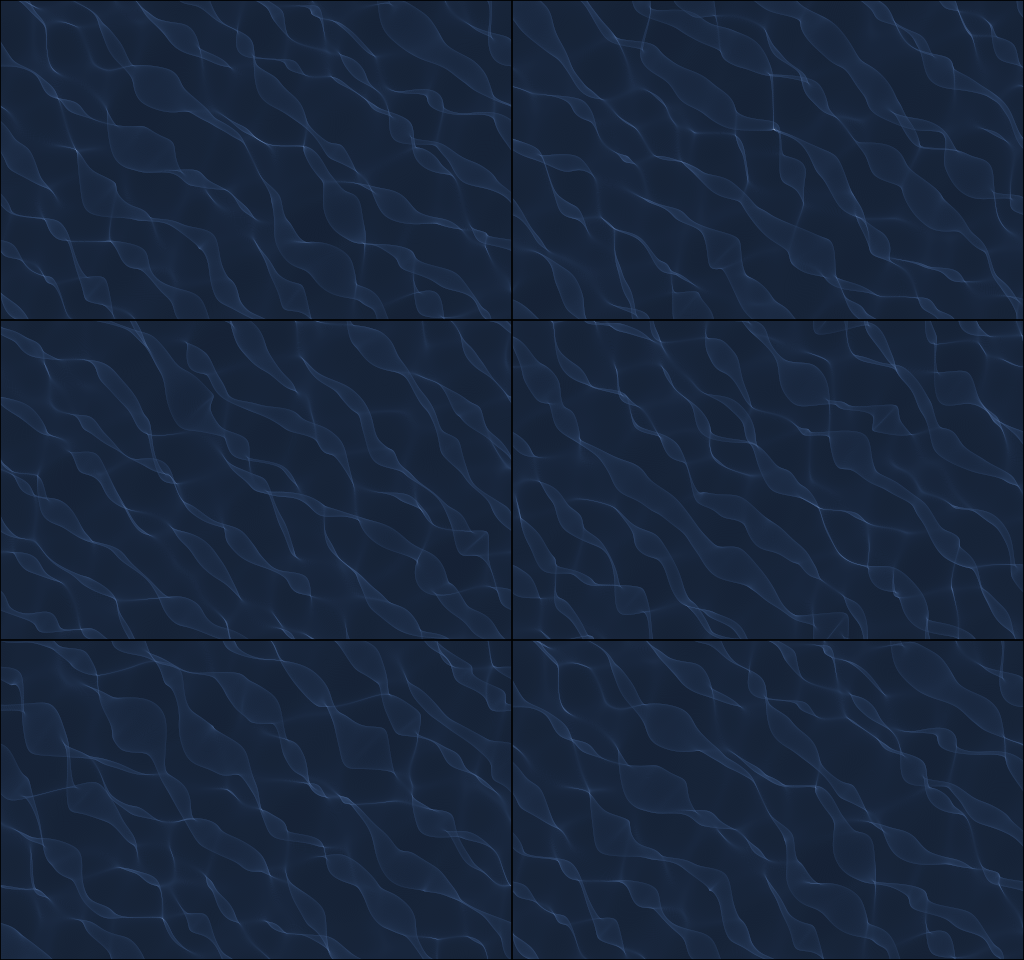
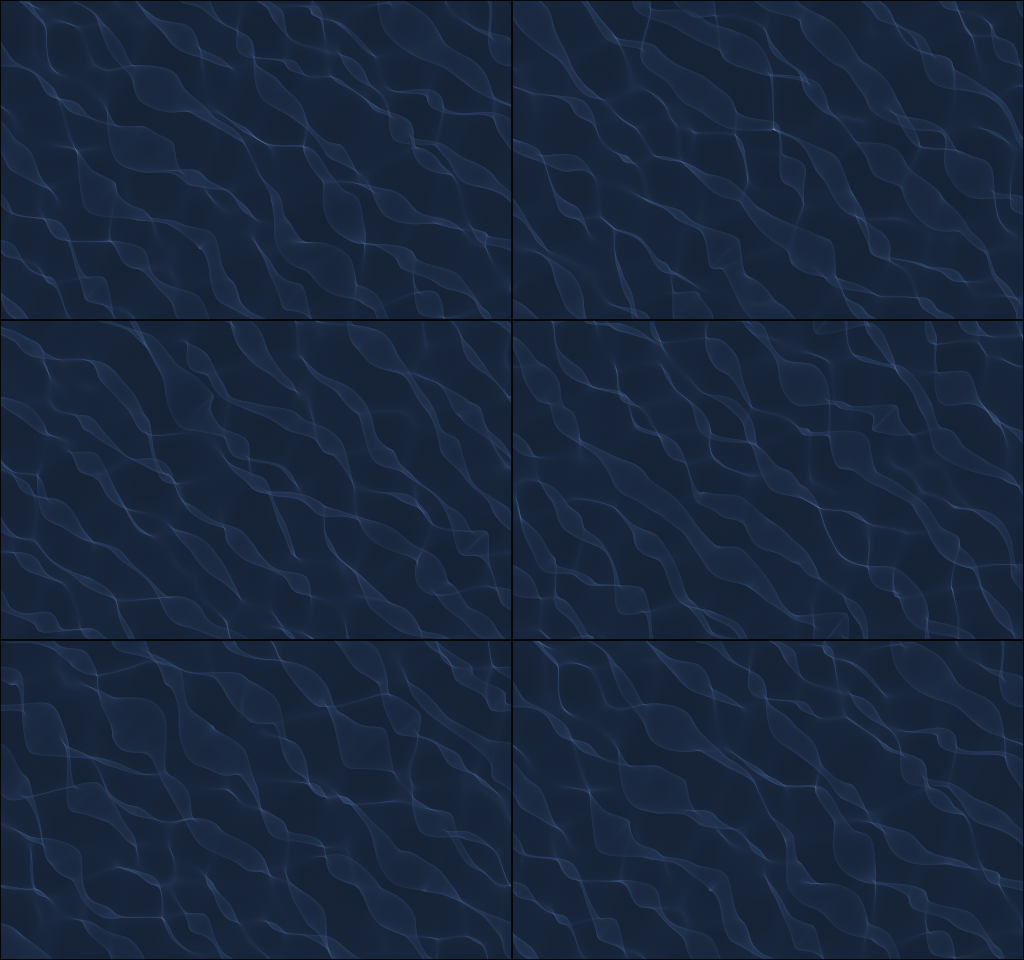
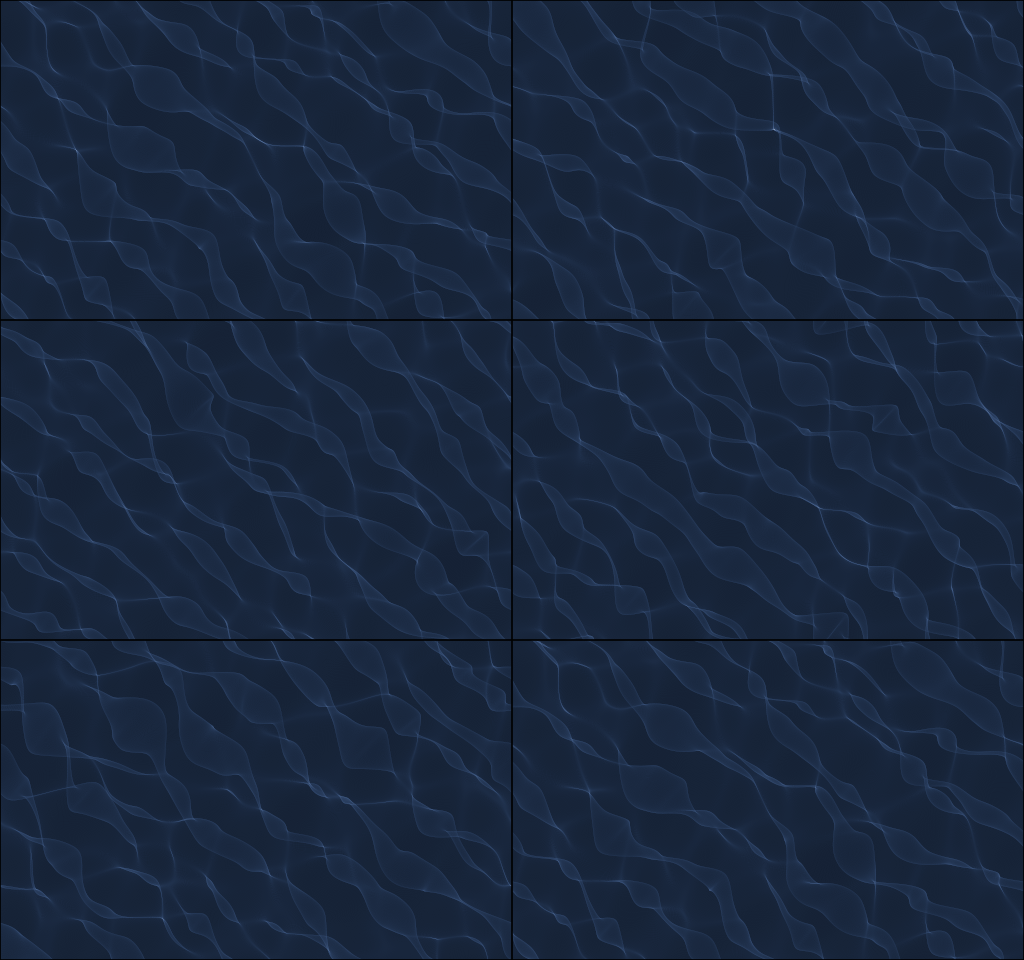
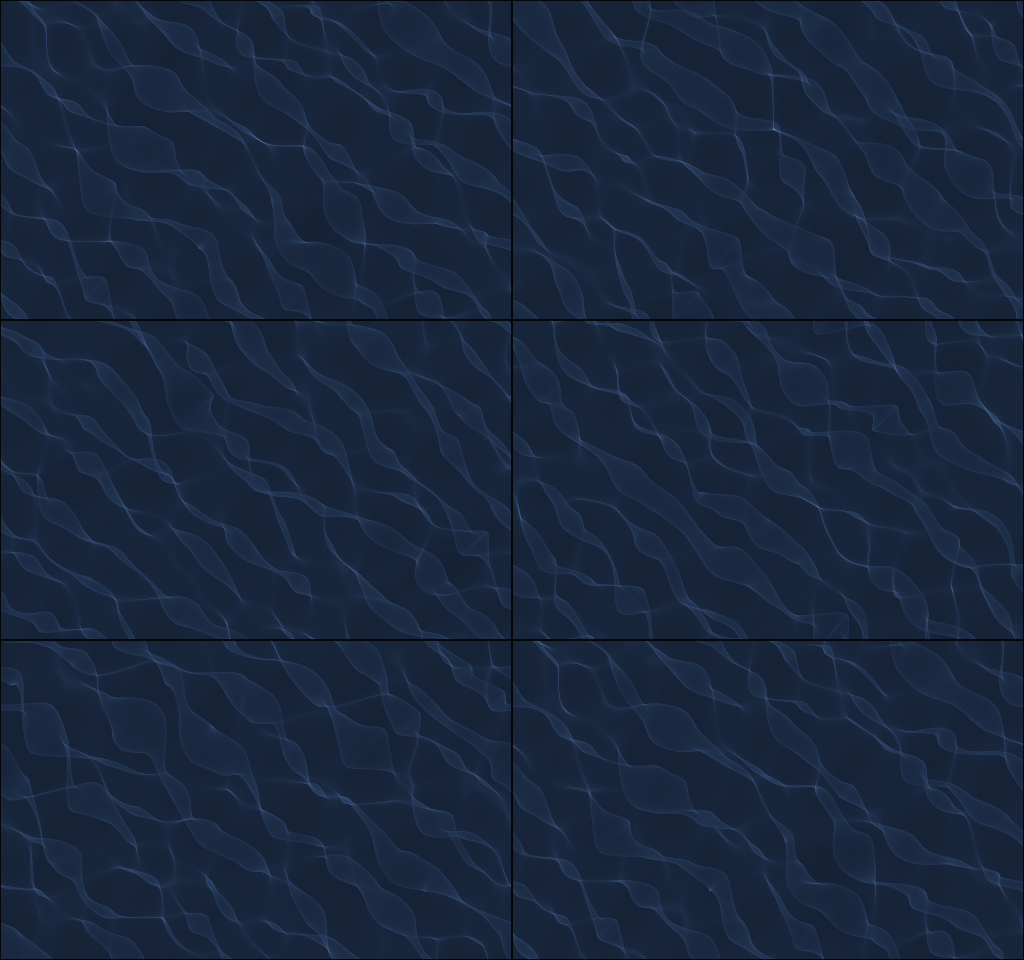
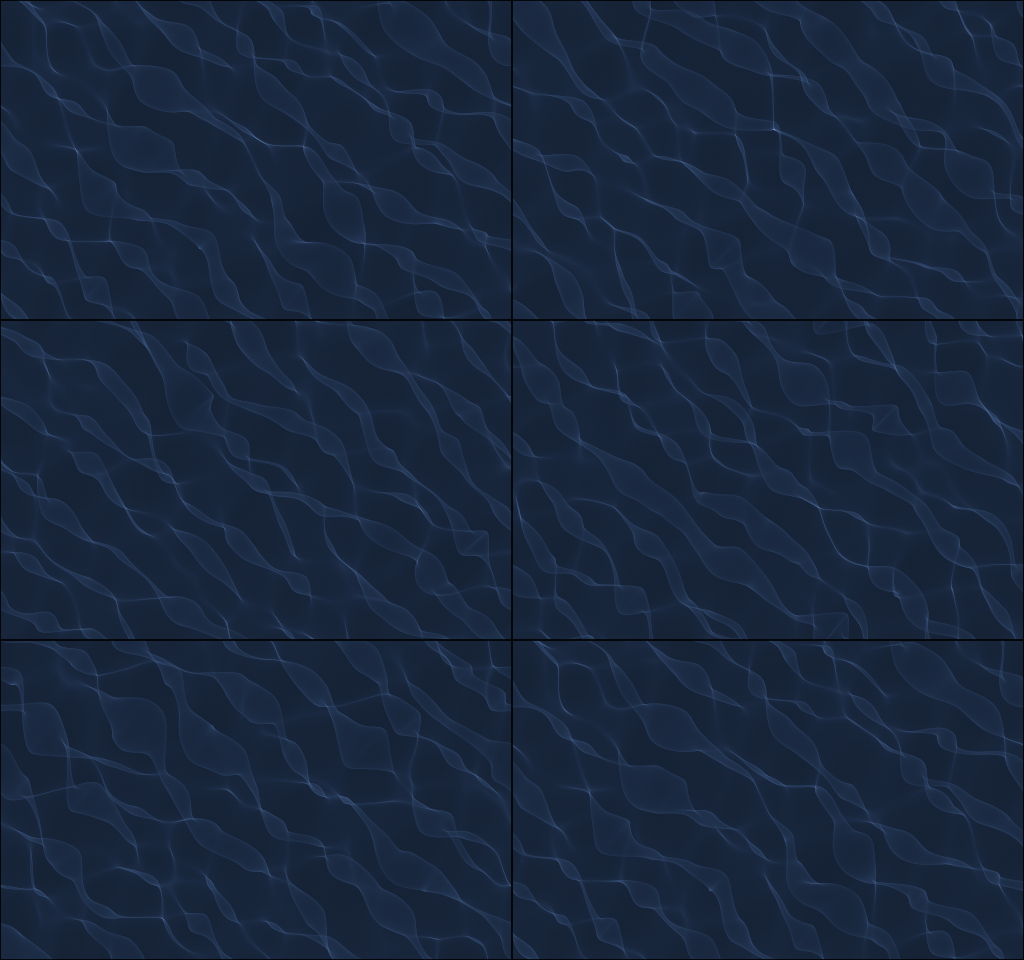
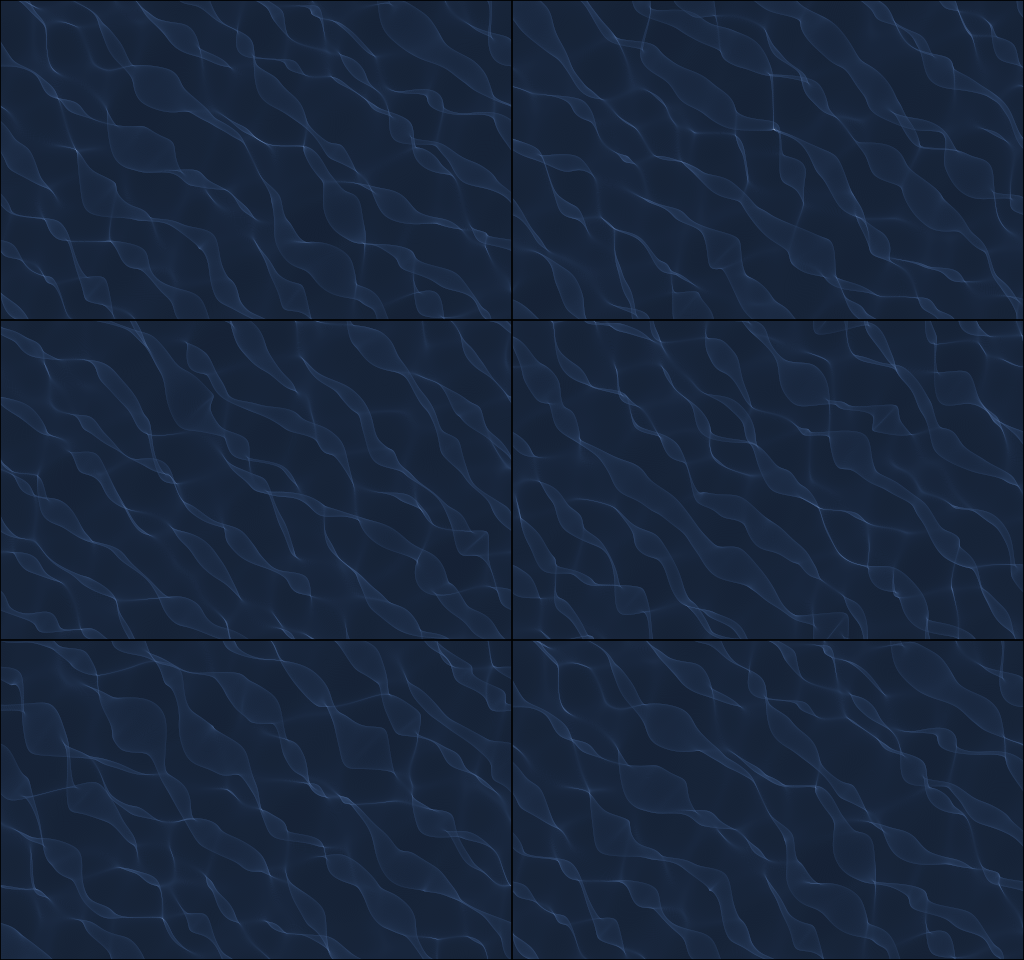
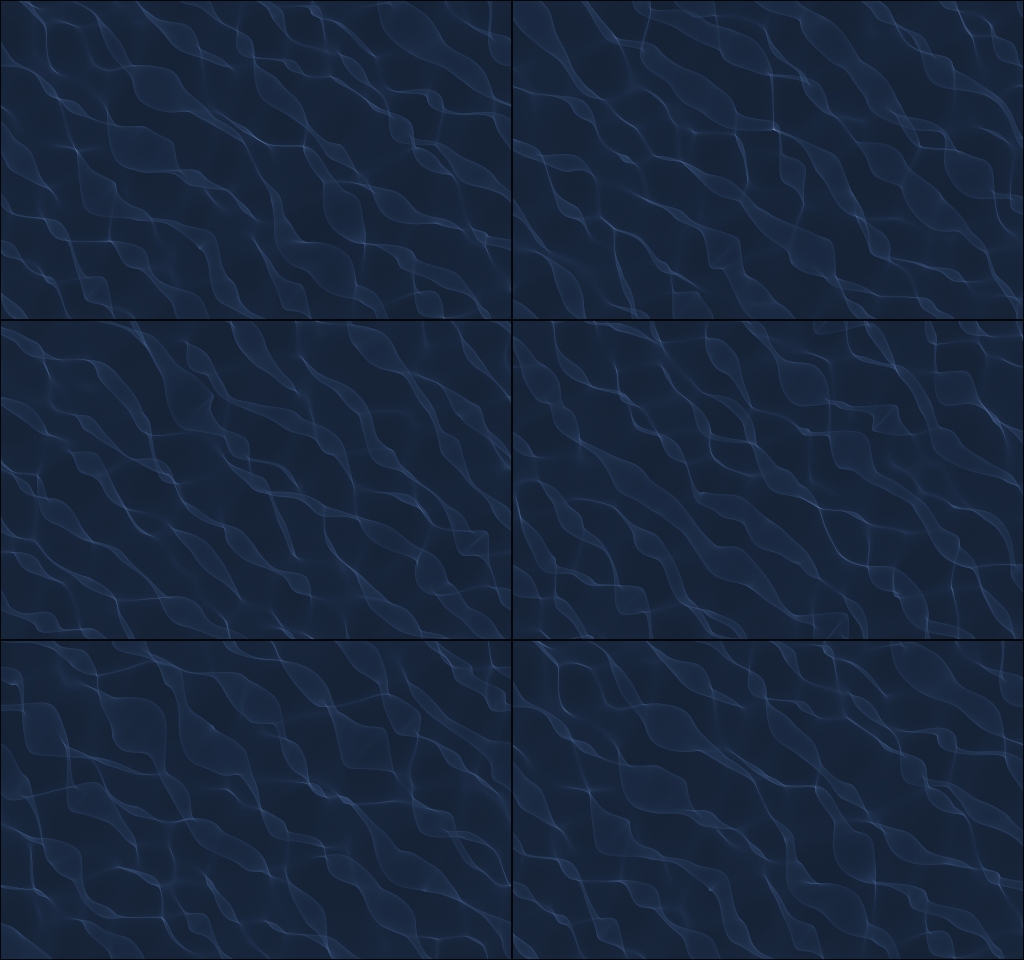
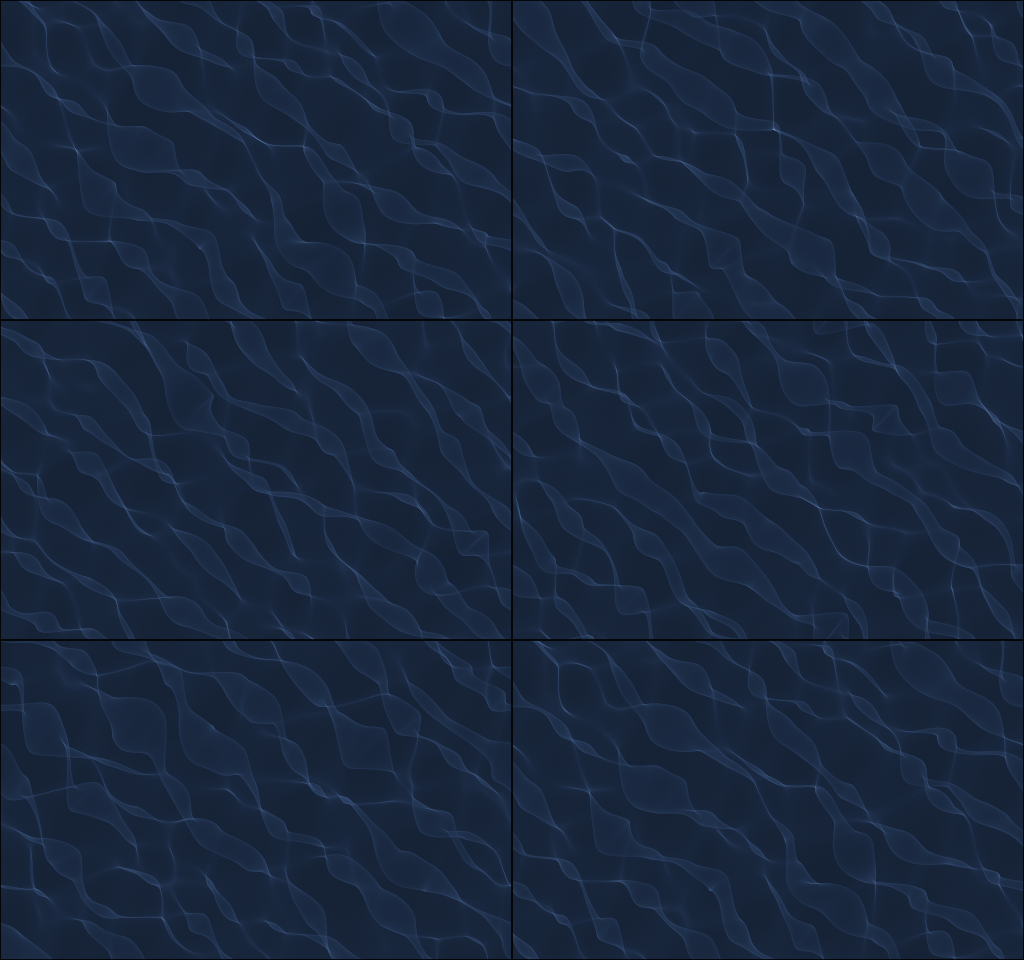
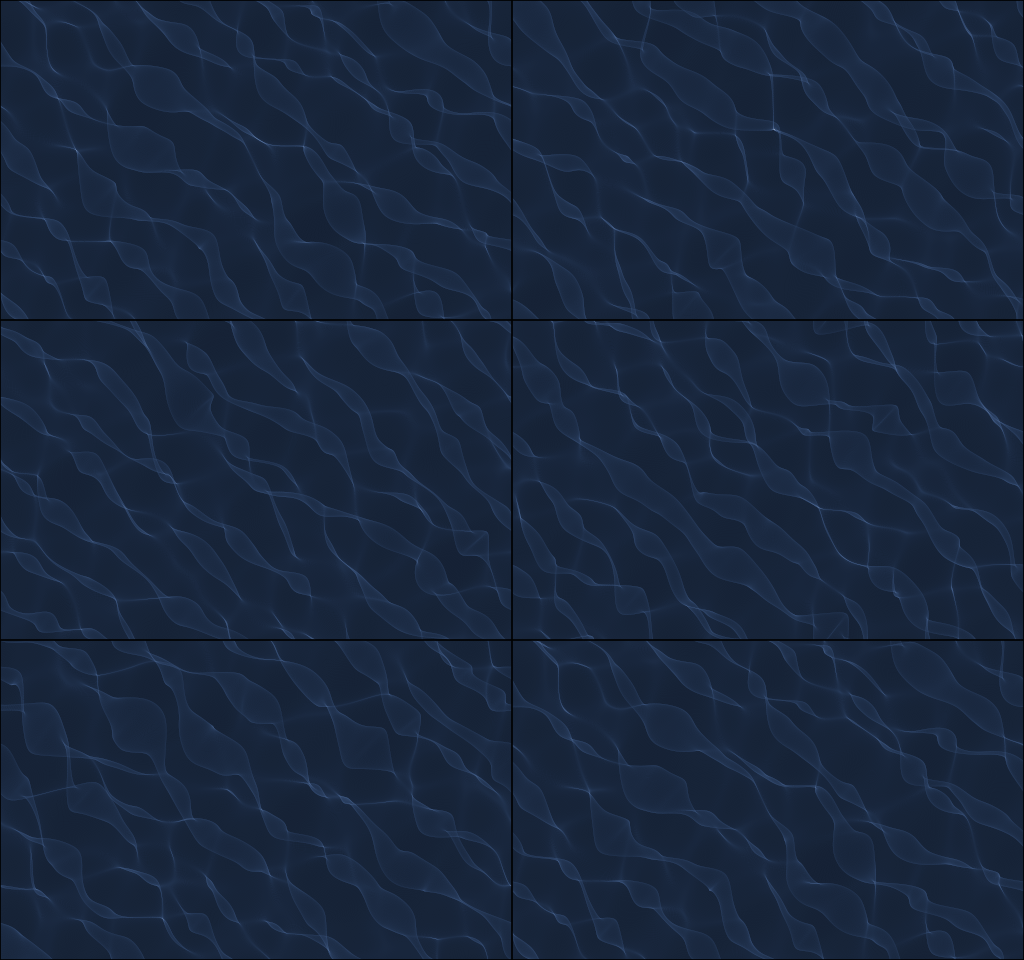
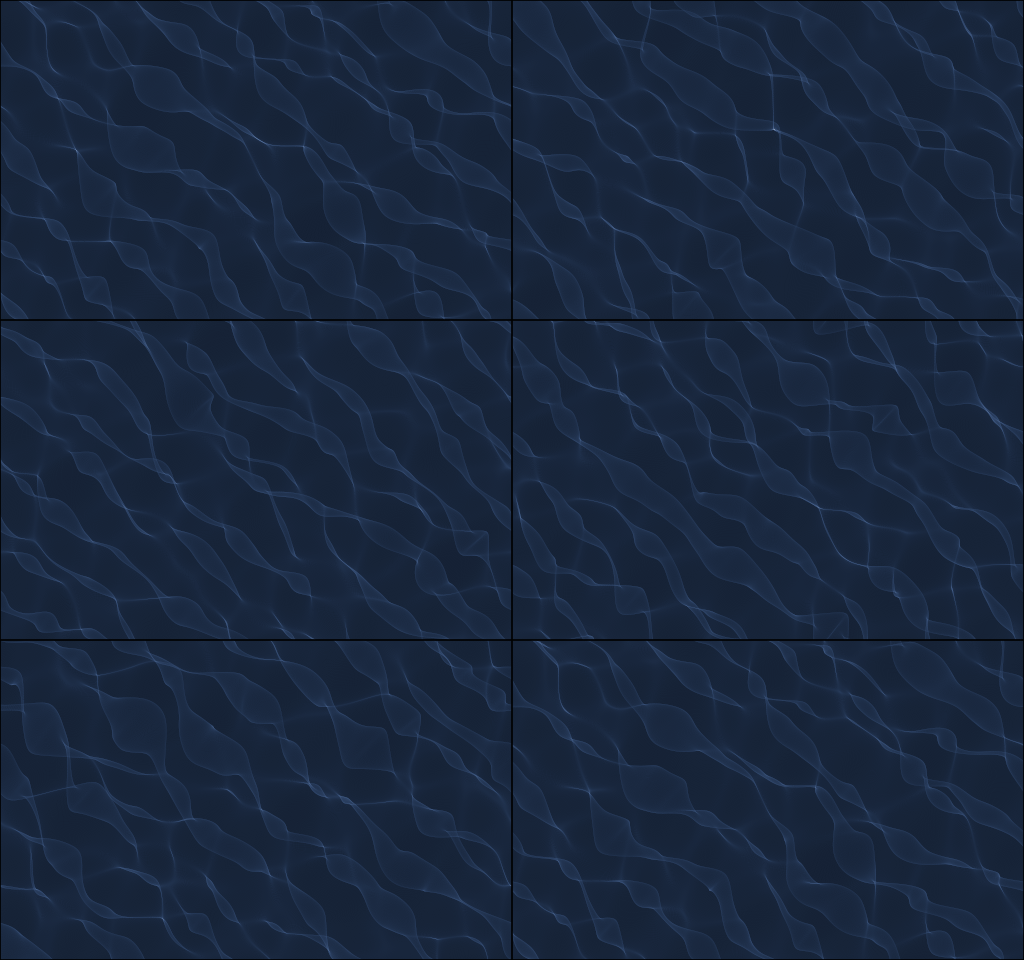
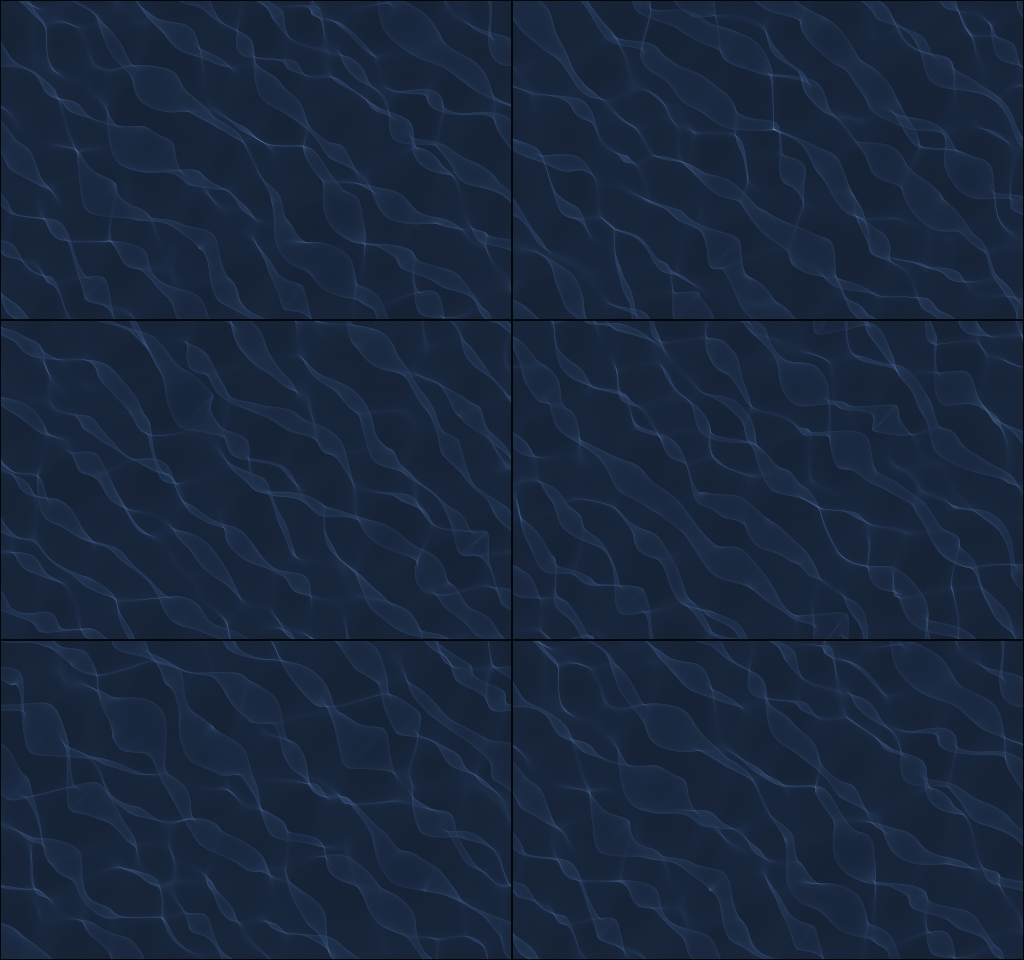
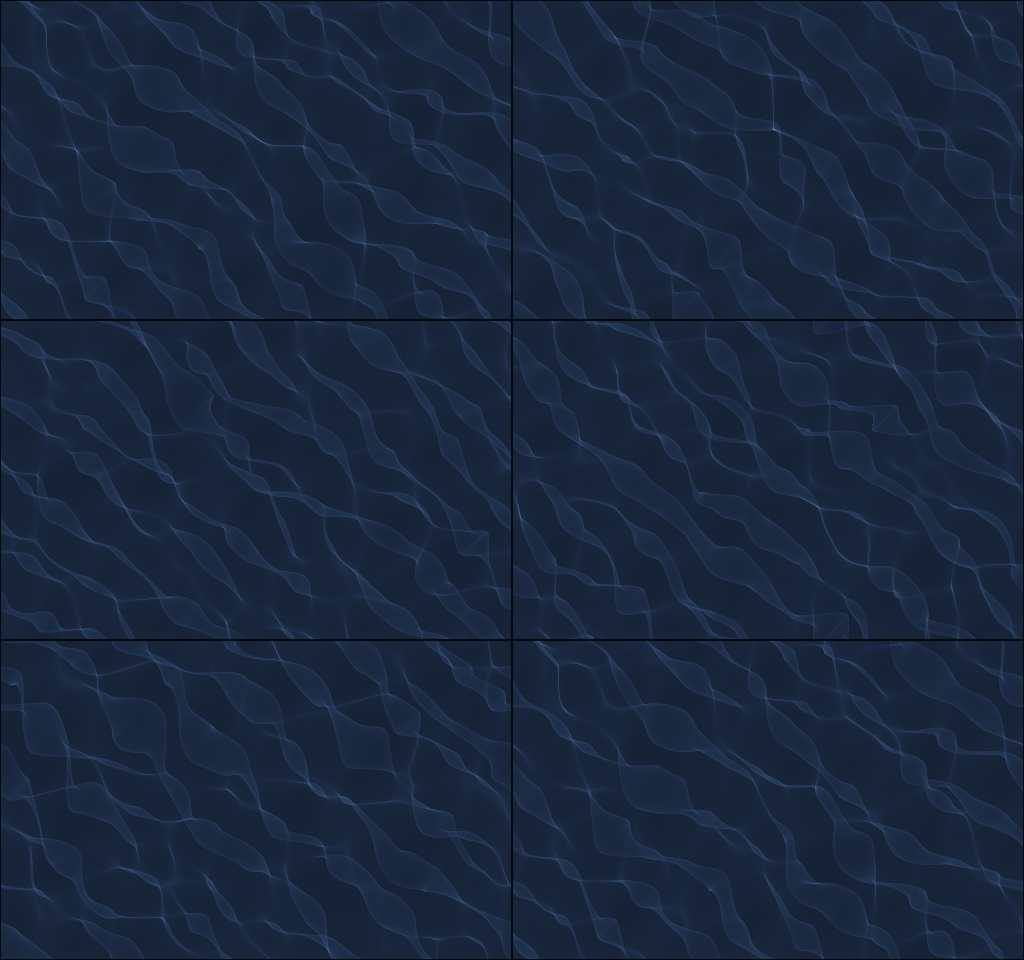
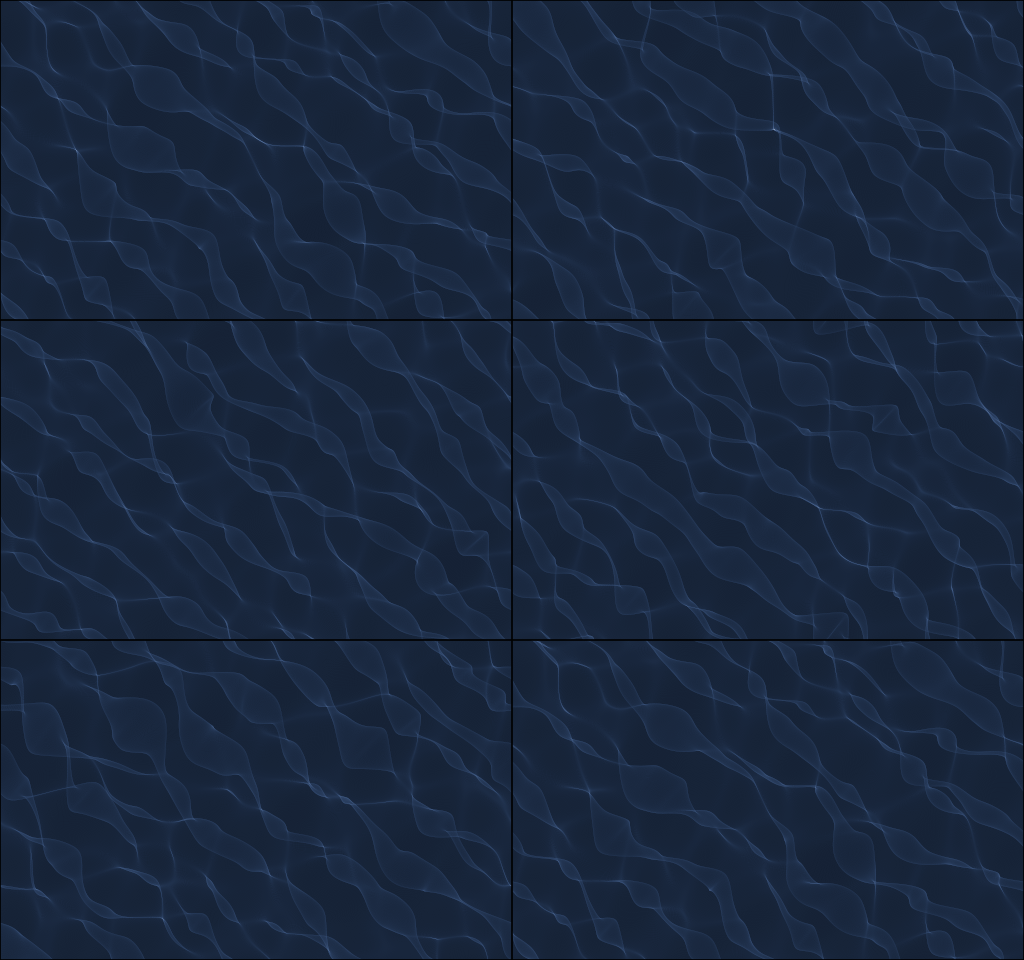
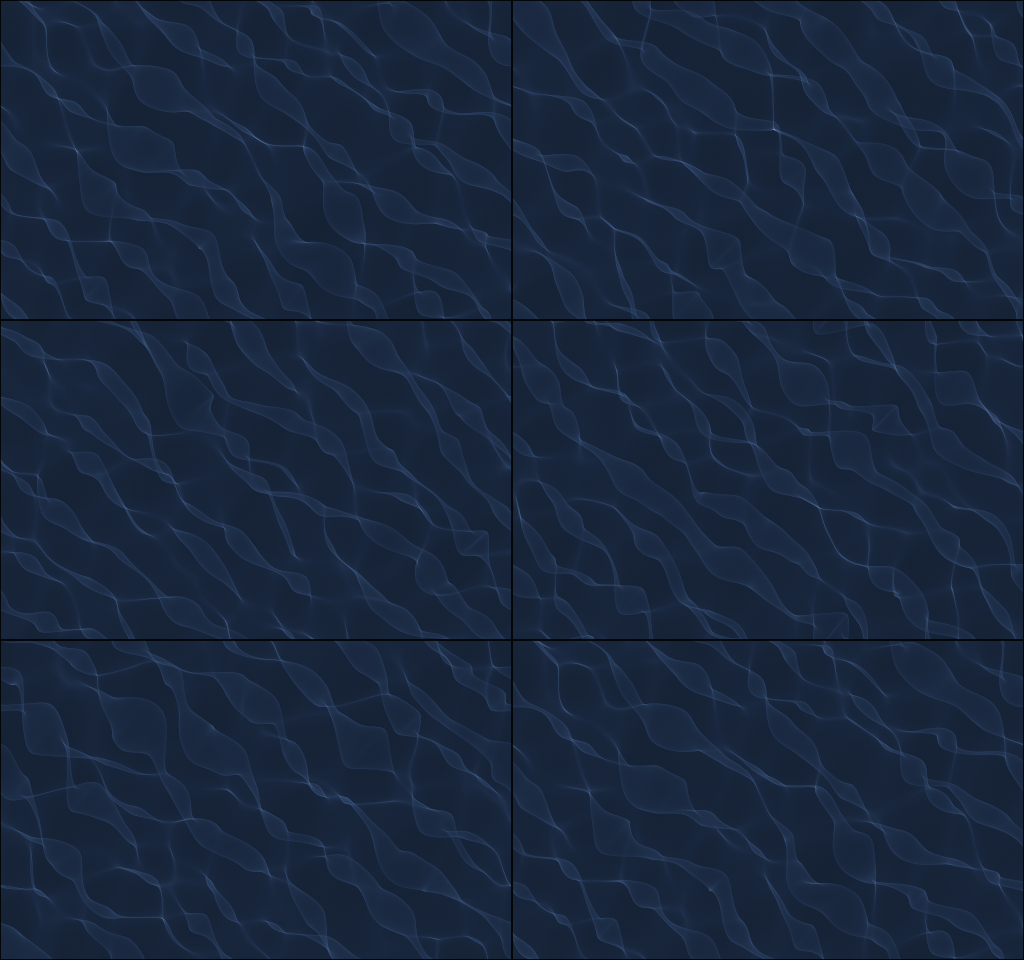
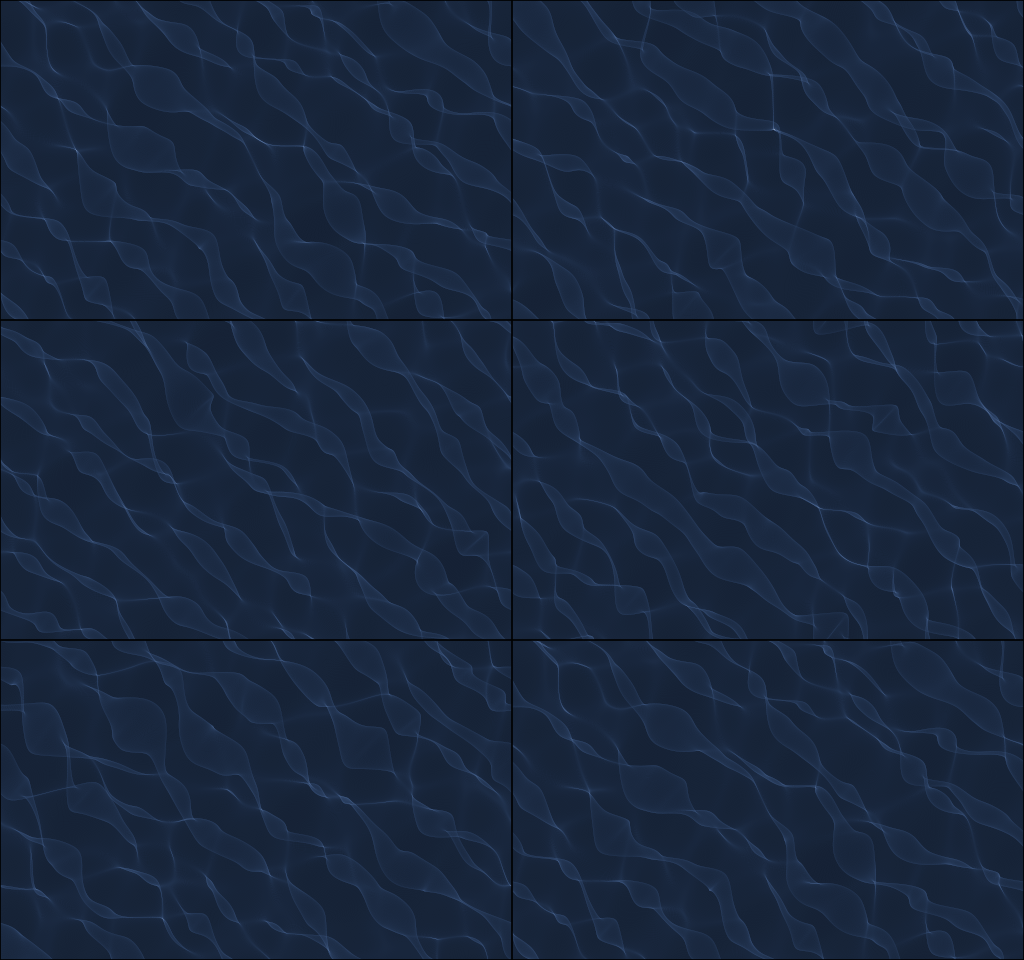
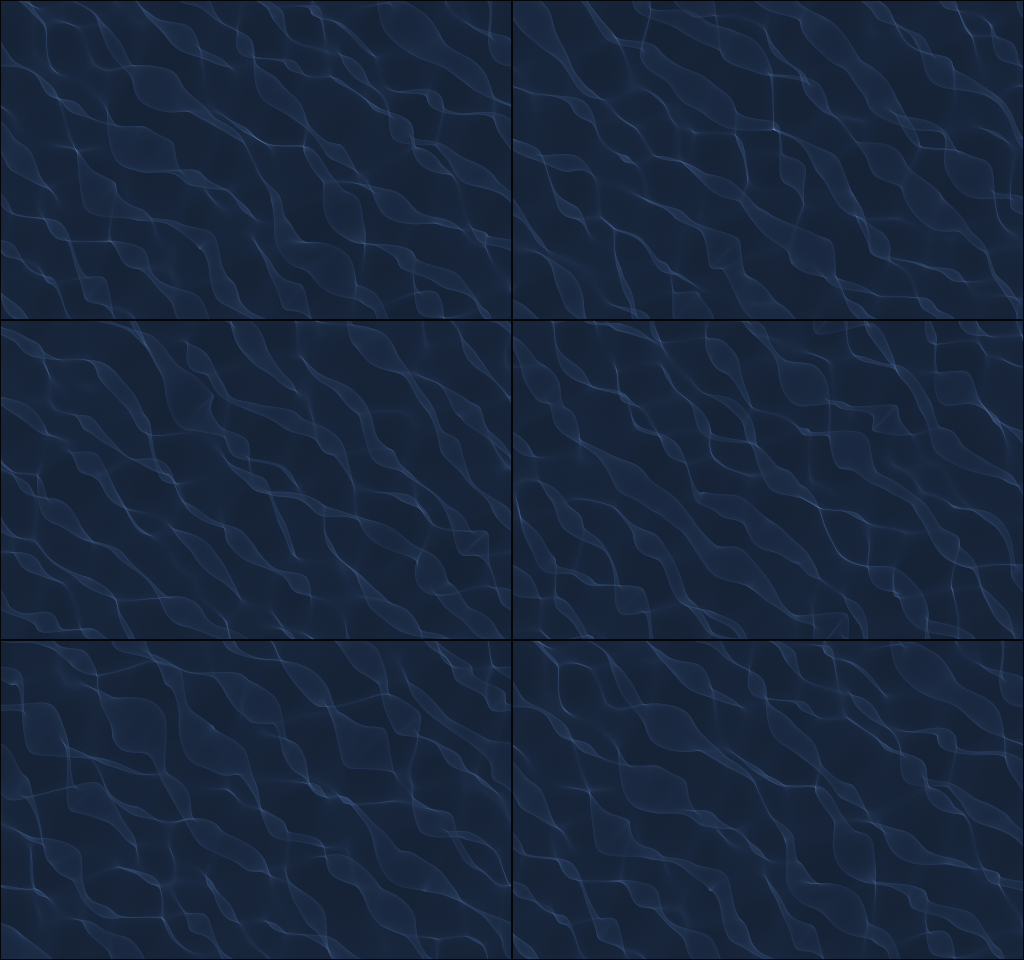
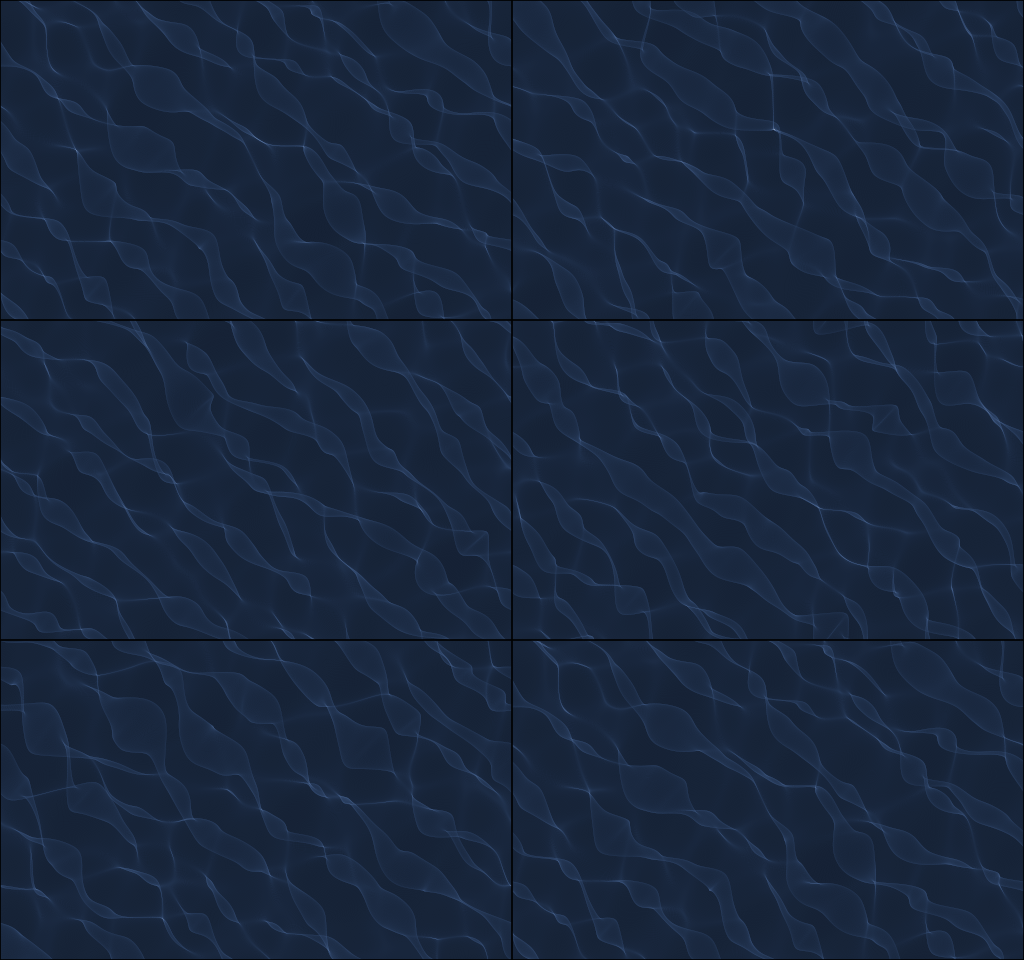
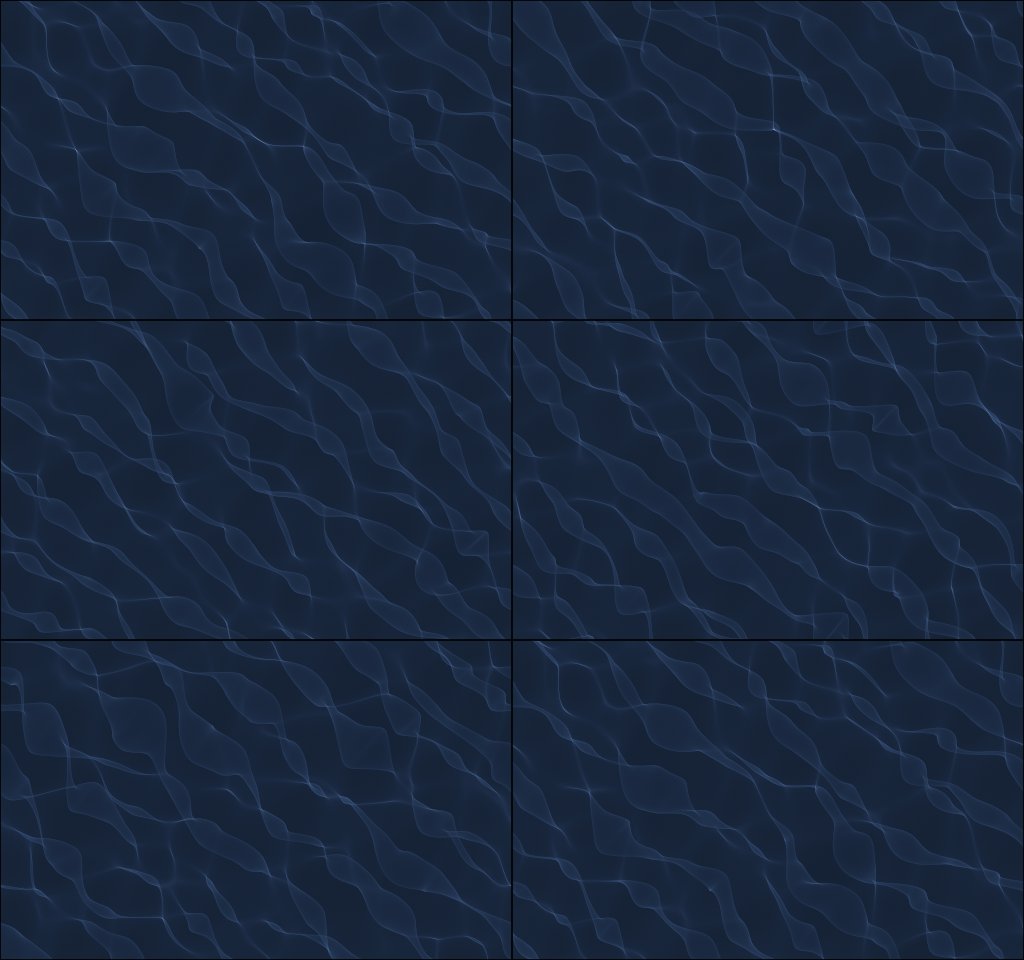
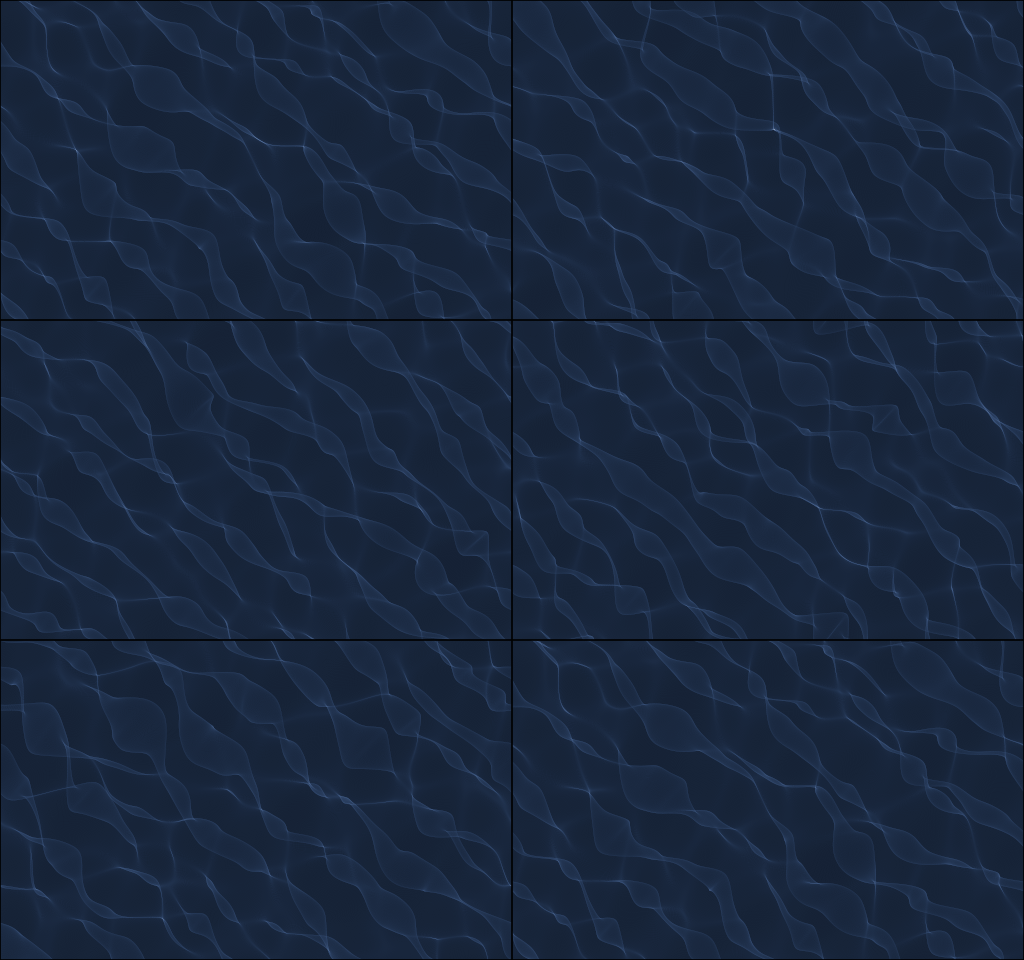
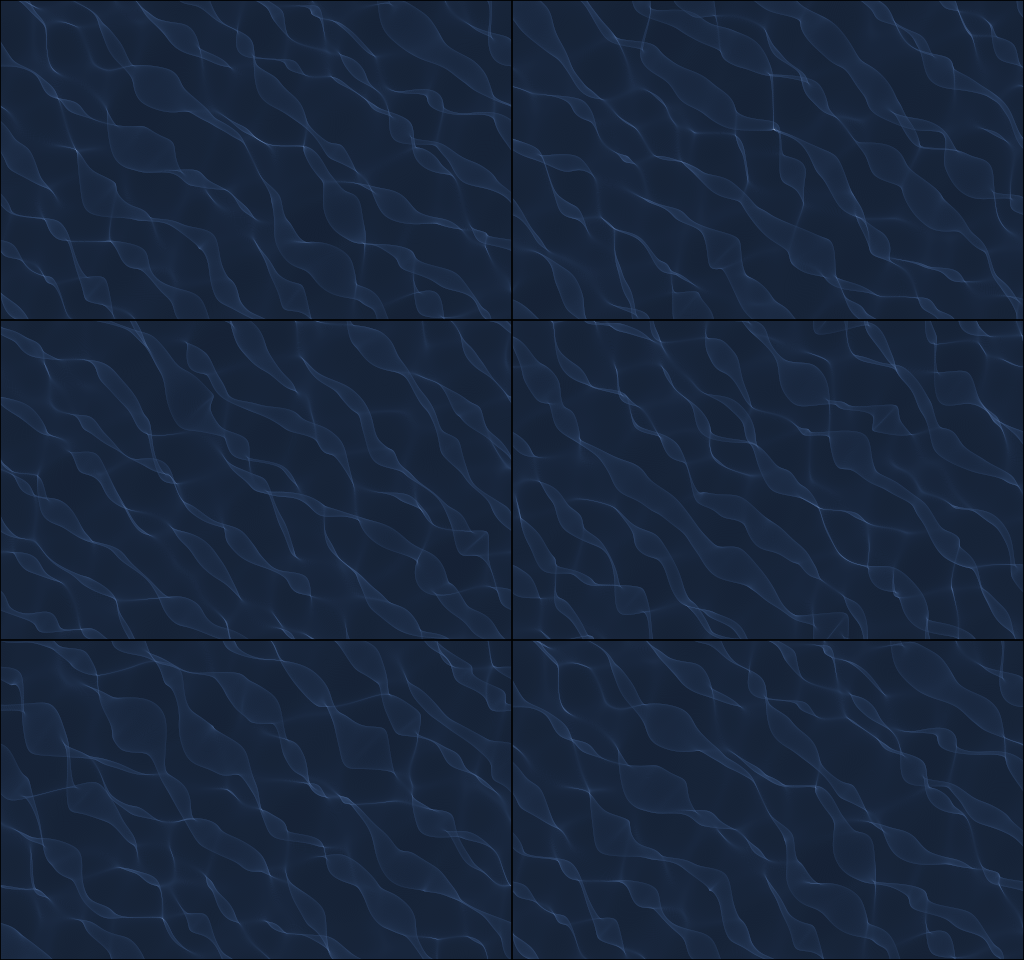
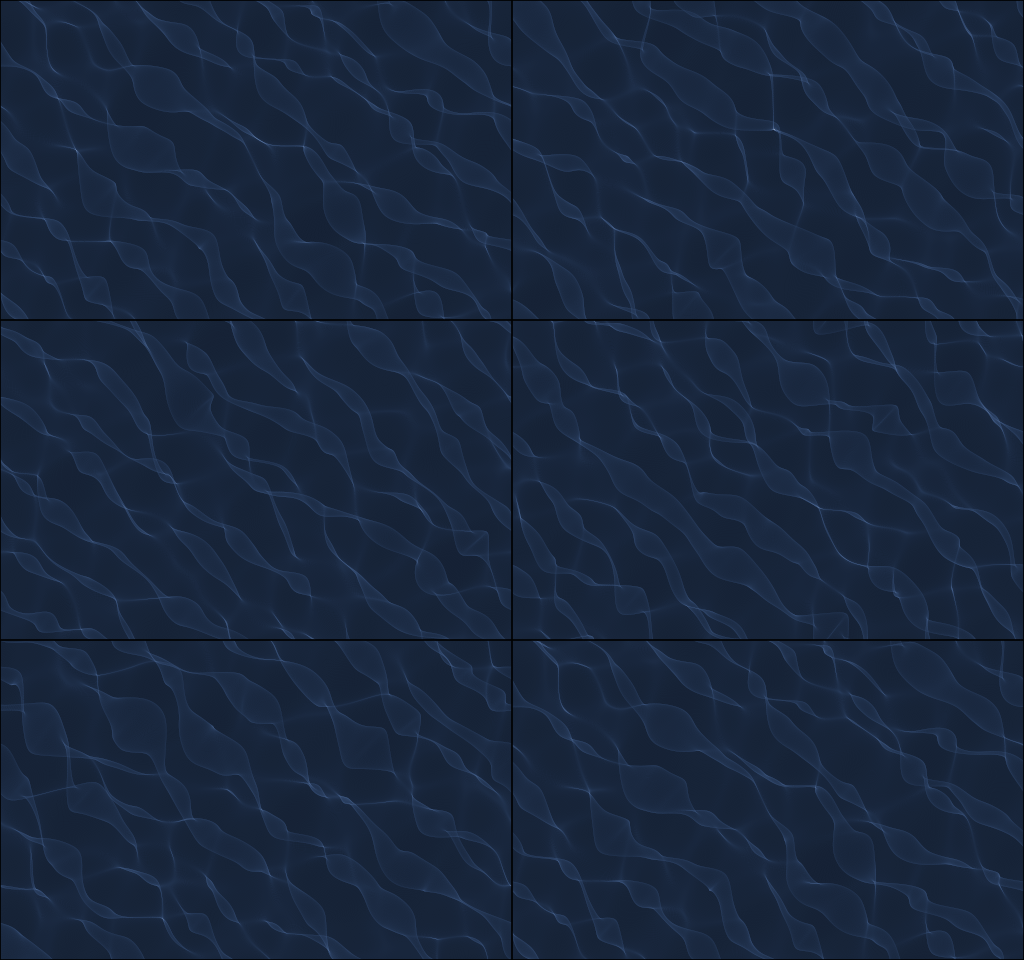
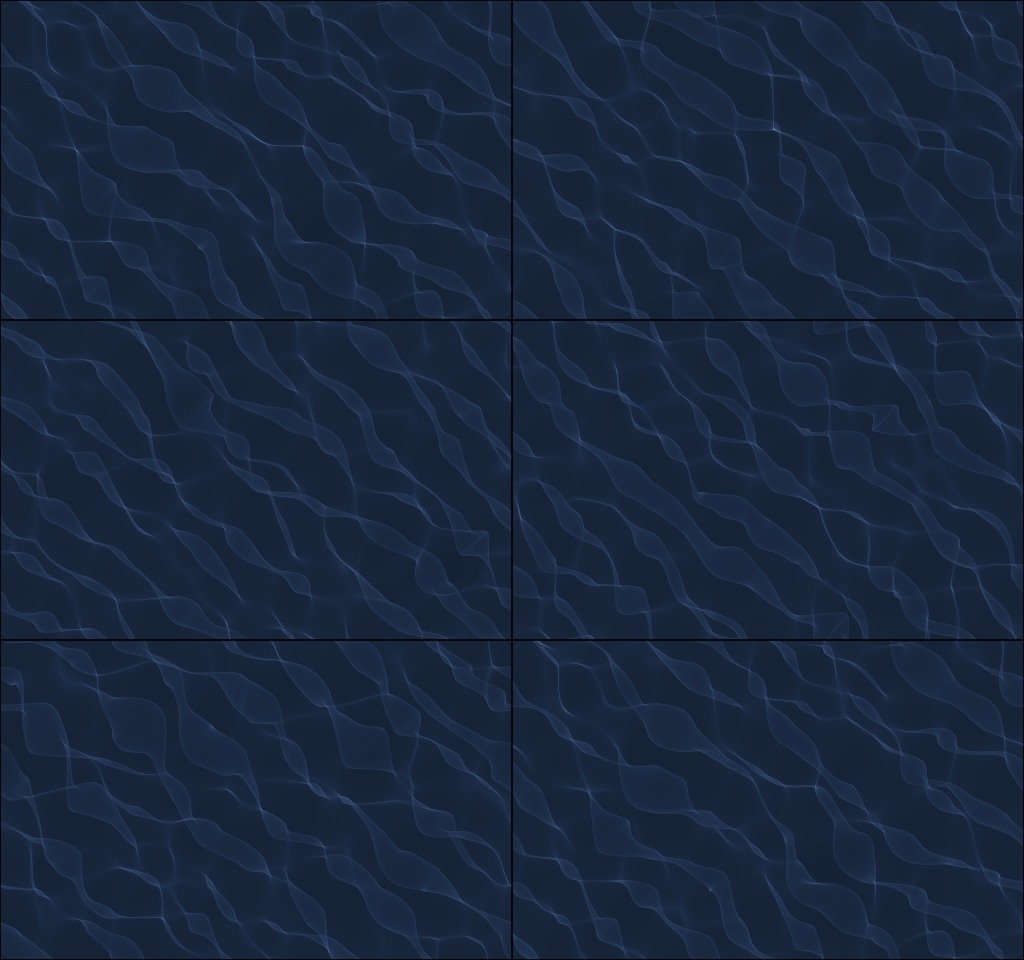
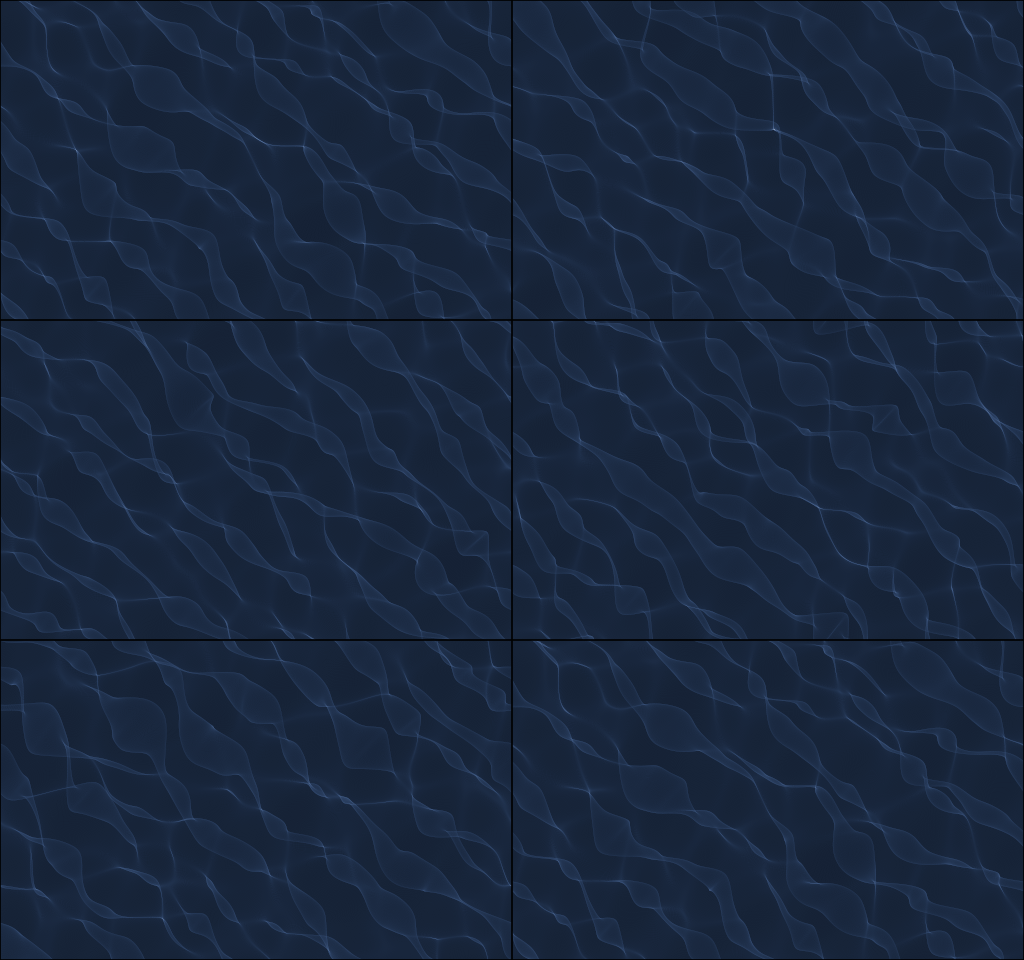
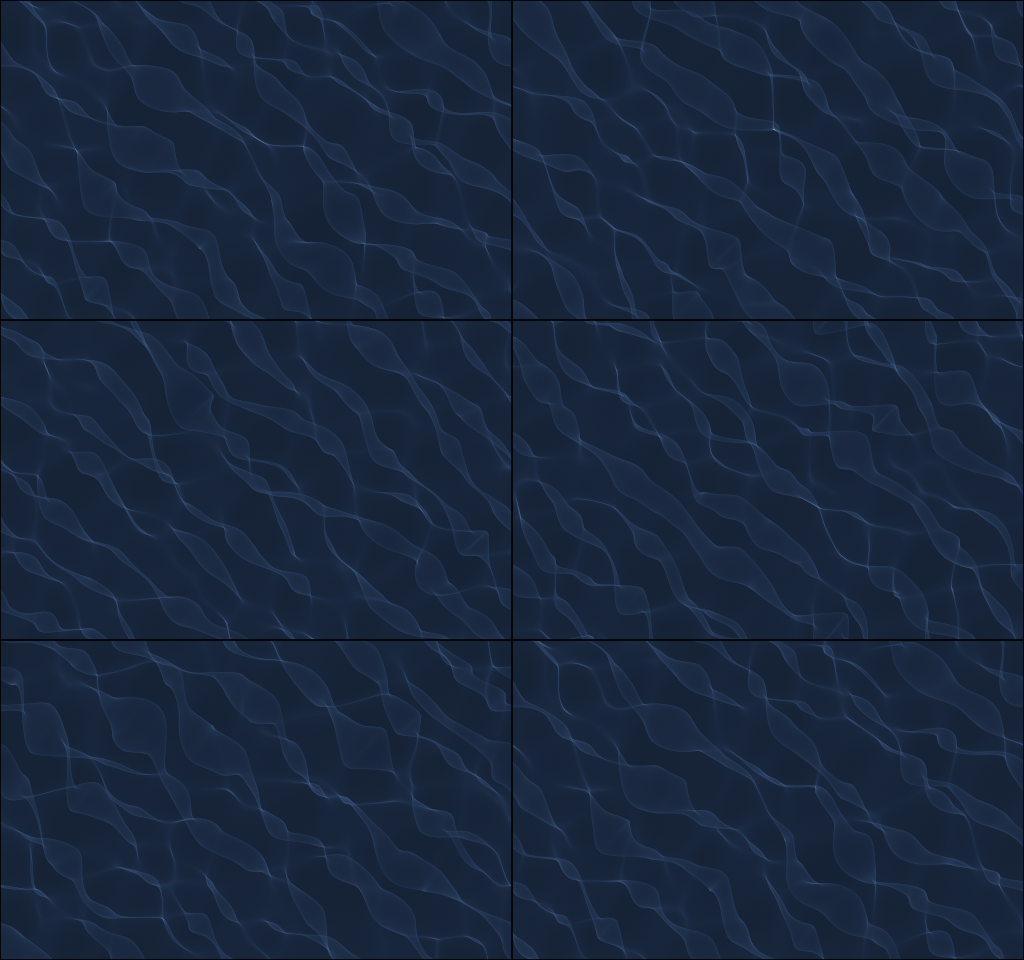
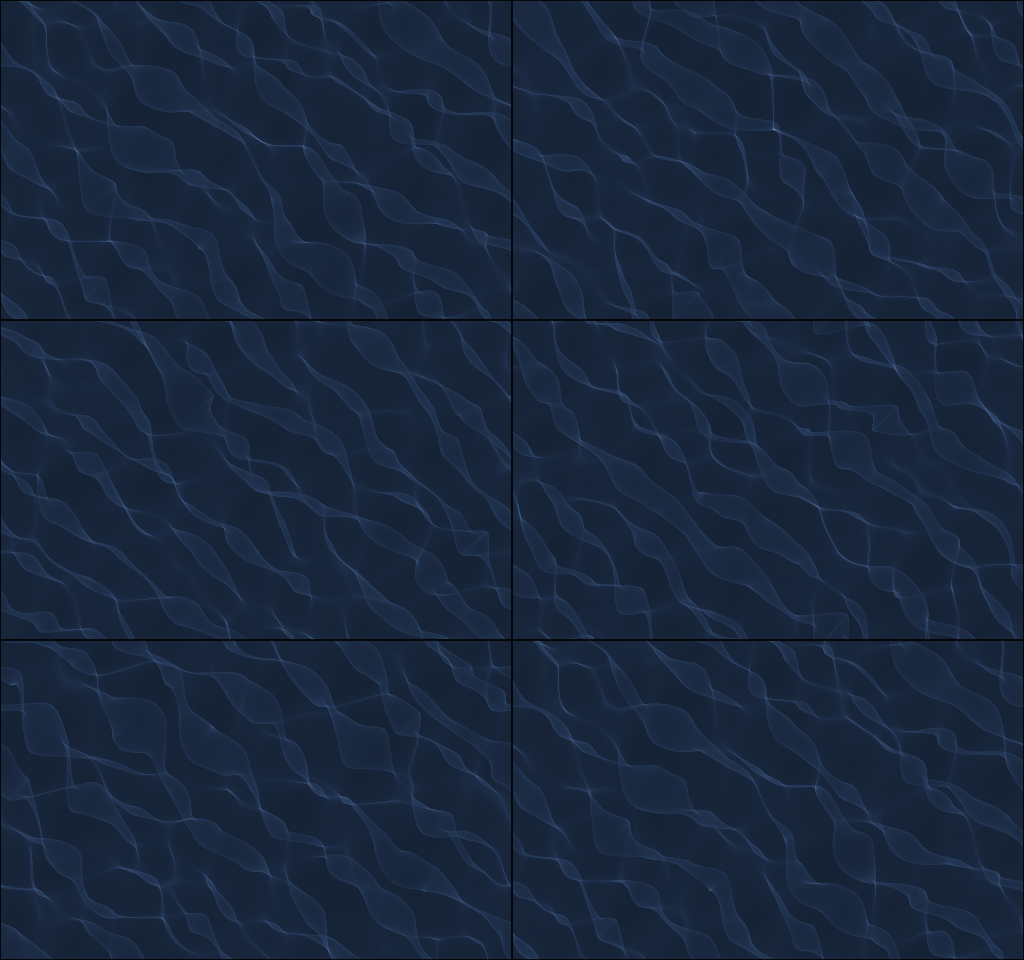
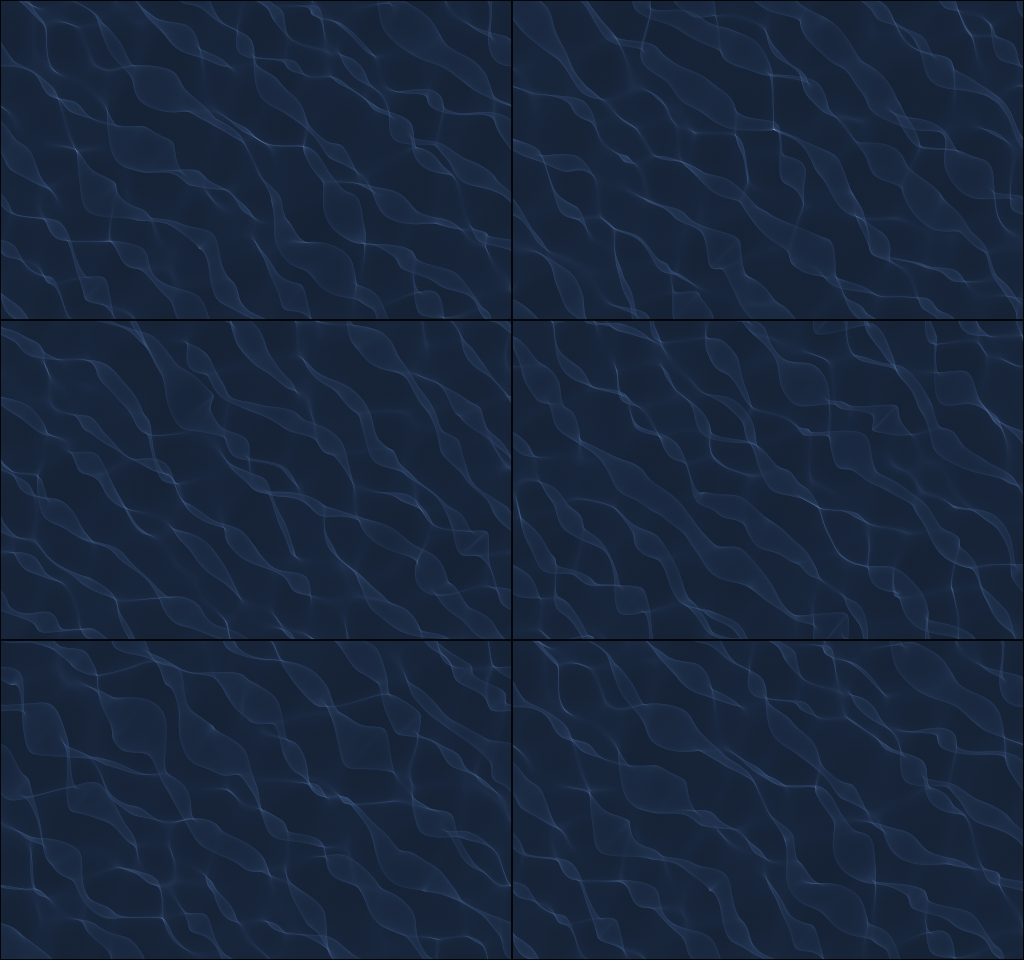
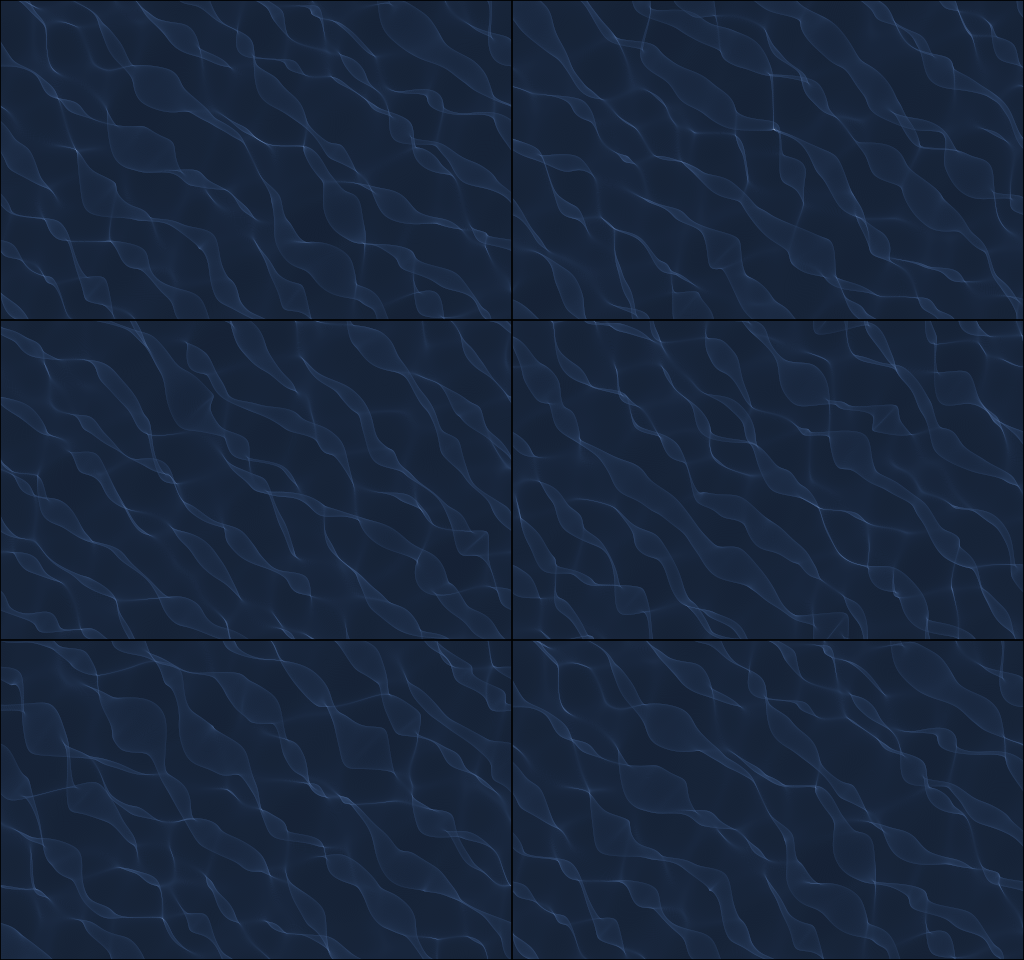
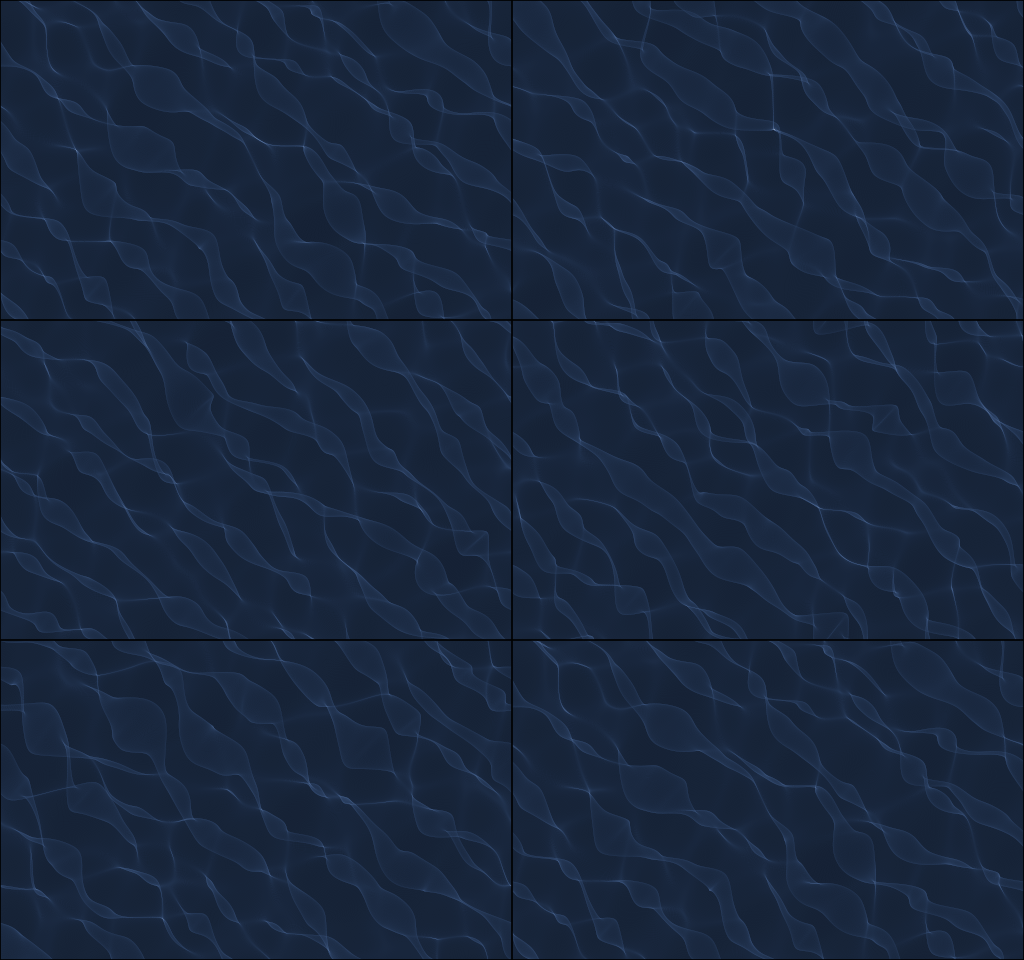
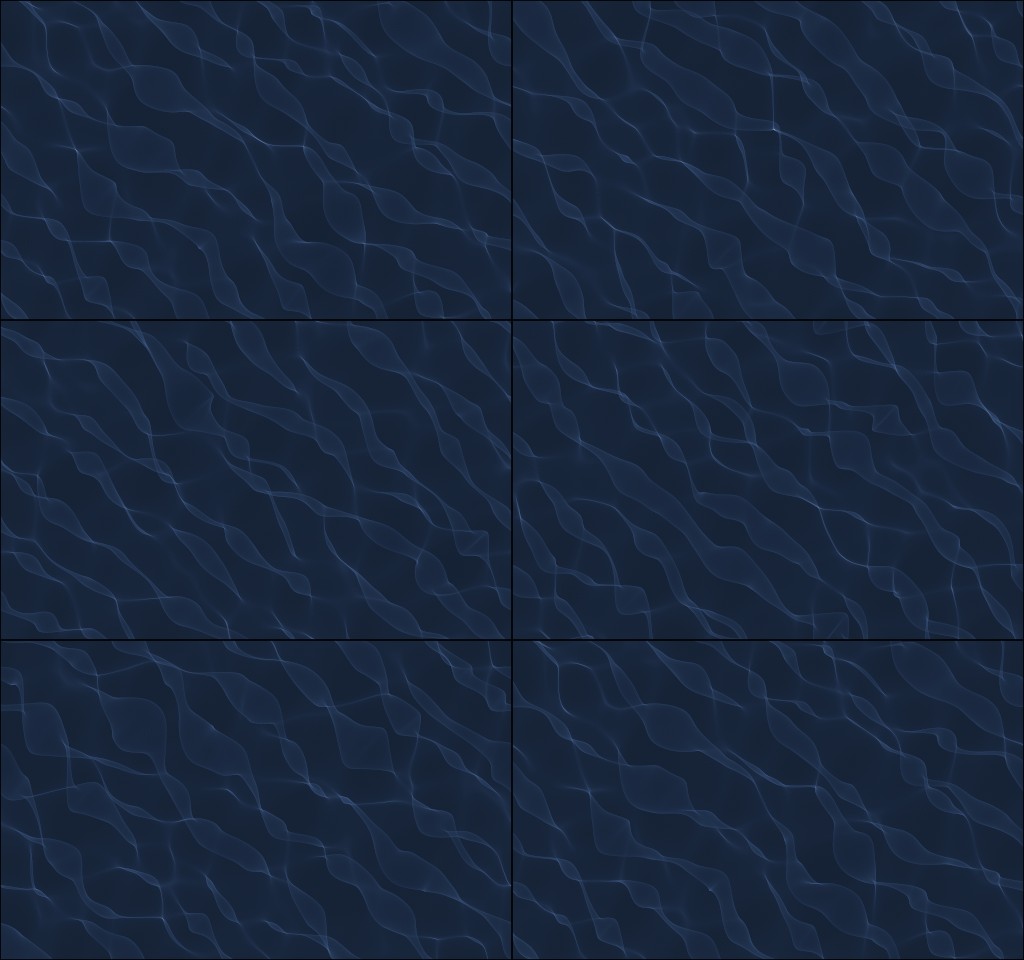
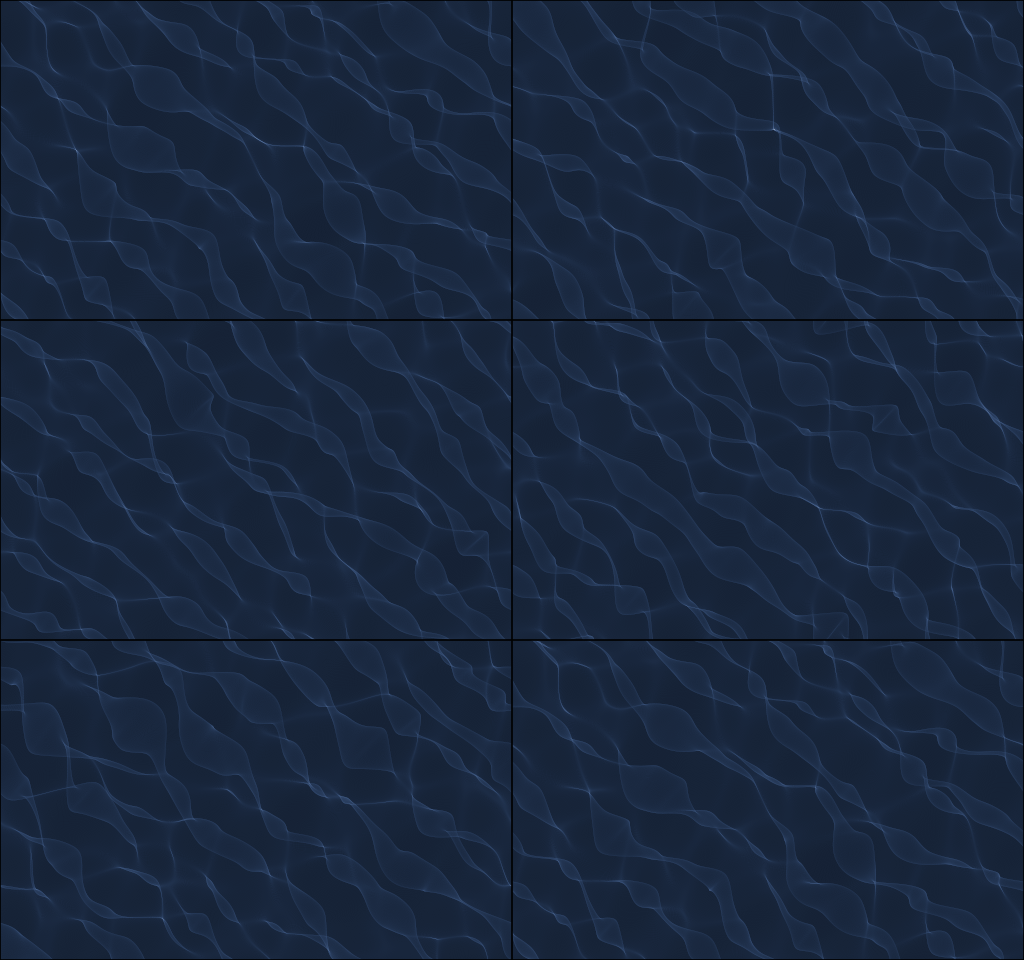
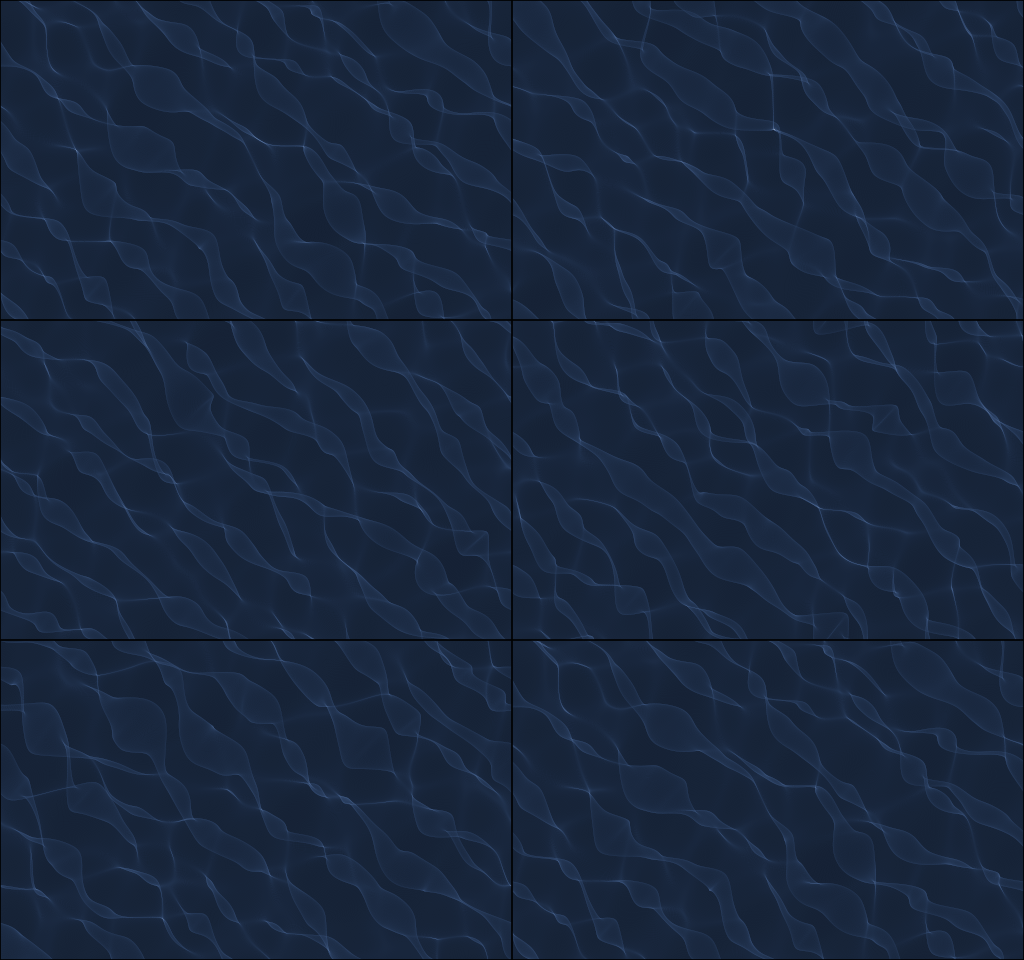
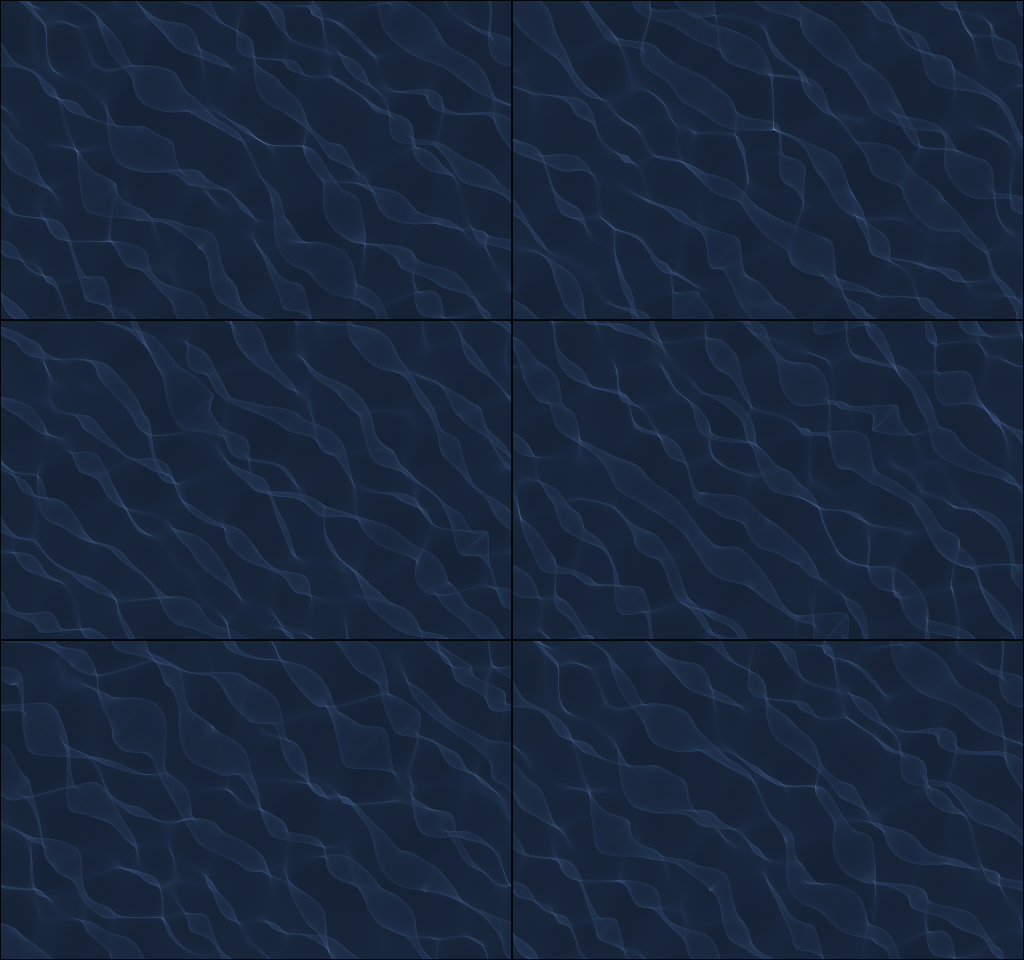
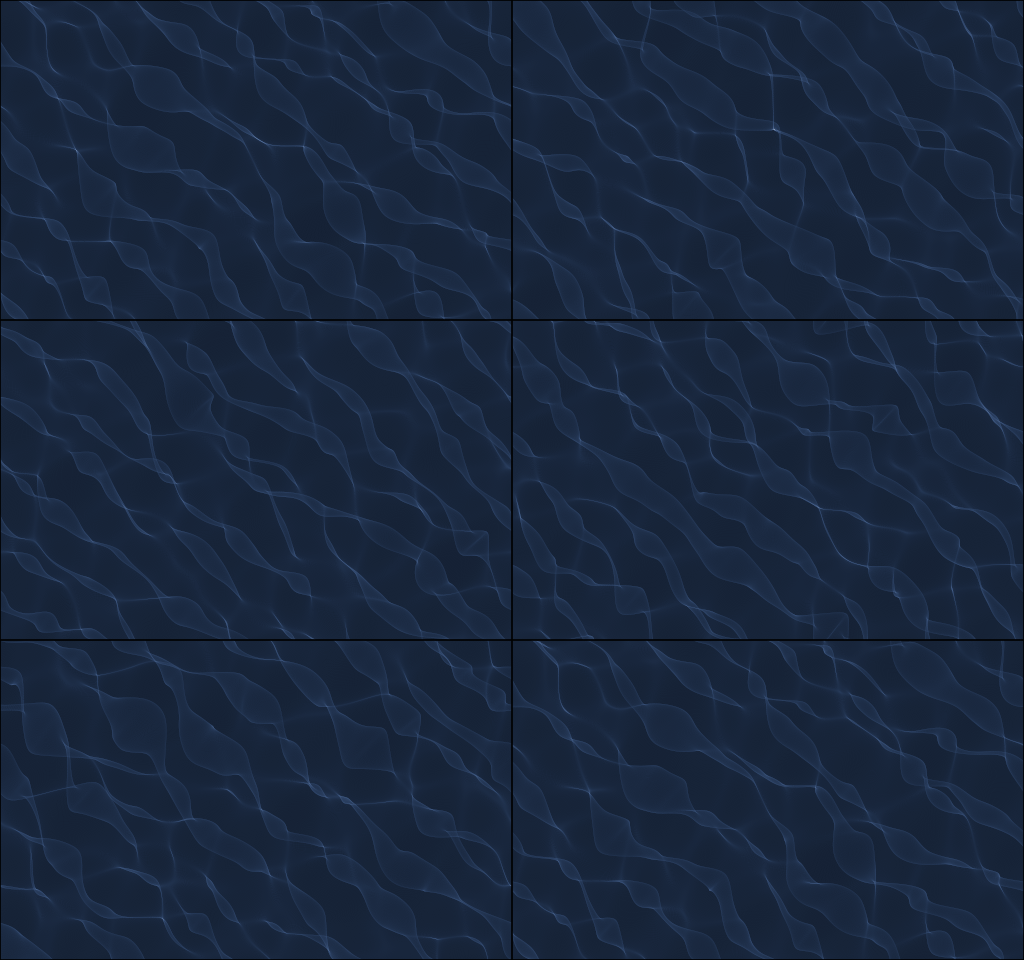
Caustics (wikipedia are luminous patterns which are resulting from the superposition of smoothly deviated light rays. It is for instance the heart-shaped pattern in your cup of coffee which is formed as the rays of the sun are reflected on the cup's surface. It is also the wiggly pattern of light curves that you will see on the floor of a pool as the sun's light is refracted at the surface of the water. Here, we simulate that particular physical phenomenon. Simply because they are mesmerizingly beautiful, but also as it is of interest in visual neuroscience. Indeed, it speaks to how images are formed (more on this later), hence how the brain may understand images.
In this post, I will develop a simple formalism to generate such patterns, with the paradoxical result that it is very simple to code yet generates patterns with great complexity, such as:
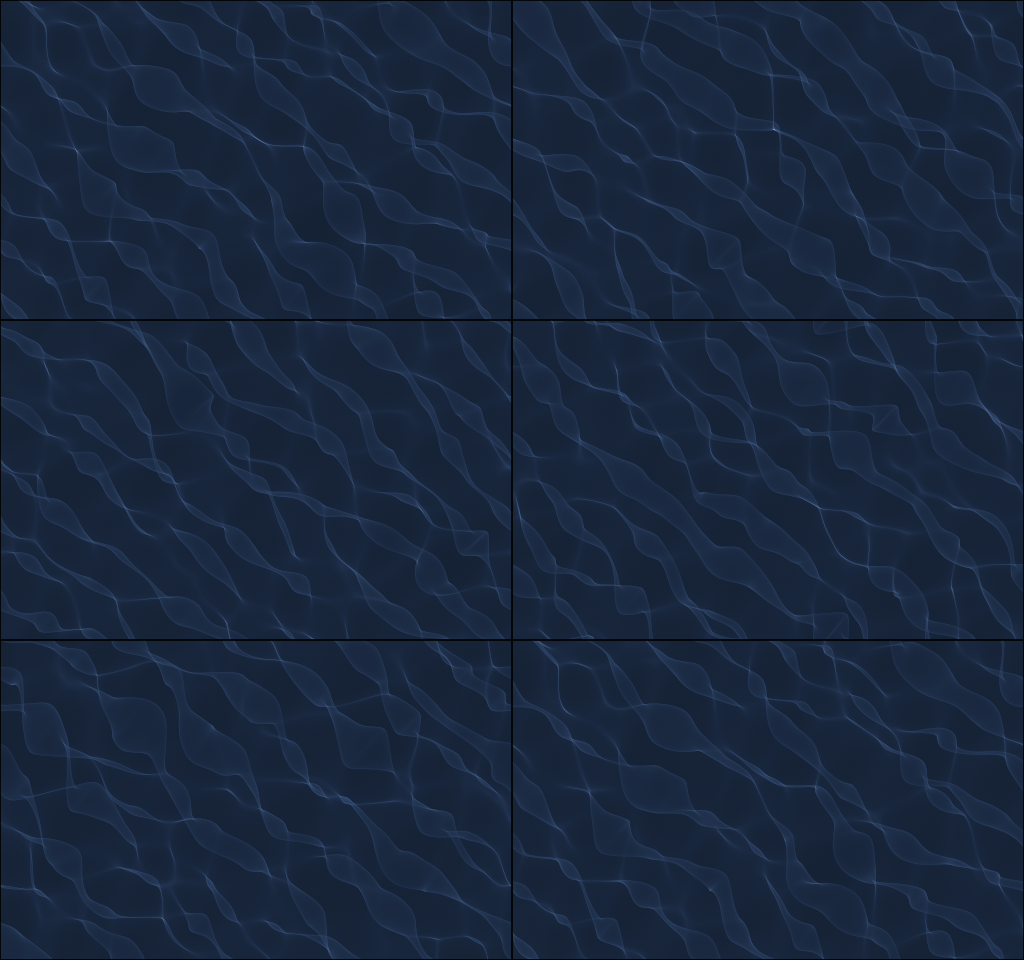
This is joint work with artist Etienne Rey, in which I especially follow the ideas put forward in the series Turbulence.
Let's begin with an import of the libraries that we will need: numpy and matplotlib (essentials!) but also MotionClouds to generate a simple waveform (more on this later in this post). These are all installable using pip (see the requirements.txt file).
import os
import matplotlib
import numpy as np
import matplotlib.pyplot as plt
import MotionClouds as mc
Let's define an unique identifier
import datetime
date = datetime.datetime.now().date().isoformat() # https://en.wikipedia.org/wiki/ISO_8601
tag = f'{date}_caustique'
tag = '2020-06-19_caustique' # overwriting tag
print(f'Tagging our simulations with tag={tag}')
And a Namespace object to store all parameters:
def init(args=[], ds=1):
    import argparse

    parser = argparse.ArgumentParser()
    parser.add_argument("--tag", type=str, default='caustique', help="Tag")
    parser.add_argument("--figpath", type=str, default='../files/2020-06-19_caustique', help="Folder to store images")
    parser.add_argument("--nx", type=int, default=5*2**8, help="number of pixels (vertical)")
    parser.add_argument("--ny", type=int, default=8*2**8, help="number of pixels (horizontal)")
    parser.add_argument("--bin_dens", type=int, default=4, help="relative bin density")
    parser.add_argument("--nframe", type=int, default=2**7, help="number of frames")
    parser.add_argument("--seed", type=int, default=42, help="seed for RNG")
    parser.add_argument("--H", type=float, default=10., help="depth of the pool")
    parser.add_argument("--sf_0", type=float, default=0.004, help="sf")
    parser.add_argument("--B_sf", type=float, default=0.002, help="bandwidth in sf")
    parser.add_argument("--V_Y", type=float, default=0.3, help="horizontal speed")
    parser.add_argument("--V_X", type=float, default=0.3, help="vertical speed")
    parser.add_argument("--B_V", type=float, default=4.0, help="bandwidth in speed")
    parser.add_argument("--theta", type=float, default=2*np.pi*(2-1.61803), help="angle with the horizontal")
    parser.add_argument("--B_theta", type=float, default=np.pi/8, help="bandwidth in theta")
    parser.add_argument("--min_lum", type=float, default=.2, help="diffusion level for the rendering")
    parser.add_argument("--fps", type=float, default=18, help="bandwidth in theta")
    parser.add_argument("--cache", type=bool, default=False, help="Cache intermediate output.")
    parser.add_argument("--verbose", type=bool, default=False, help="Displays more verbose output.")

    opt = parser.parse_args(args=args)

    if opt.verbose:
        print(opt)
    return opt

opt = init()
opt.tag = tag
opt
This object is always handy when we will try to explore some parameters.
A last utility function is a way to convert the resulting numpy array to a set of images and then to an animated GIF using imageio and pygifsicle:
def make_gif(gifname, fnames, fps):
    import imageio

    with imageio.get_writer(gifname, mode='I', fps=fps) as writer:
        for fname in fnames:
            writer.append_data(imageio.imread(fname))

    from pygifsicle import optimize
    optimize(str(gifname))
    return gifname
from IPython.display import Image, display
width = 1024
What is a caustic?
A caustic usually refers to the image which is formed by the convergence or divergence of rays on a surface. Mathematically, this may be understood as the enveloppe of a set of rays, and intuitively, it is best understood by looking at the best known example: When the sun hits a glass or cup and you see heart-shaped pattern (actually more a kidney than a heart, hence the name "nephroid"):
(image by User:Paul venter).
Their study is essential in optics, as these are the bases for lenses and therefore of central importance in our image-centered society :-)
They are also of interest simply because they create mesmerizing patterns in nature, for instance the pattern of wiggly lines on swimming pool bottoms, or on the sea floor at shallow depths.
The formation of that specific pattern is very well illustrated by this animation (credit Jacopo Bertolotti, check-out that twitter thread) where light comes from the bottom, travels through air, hits the surface and gets deviated:
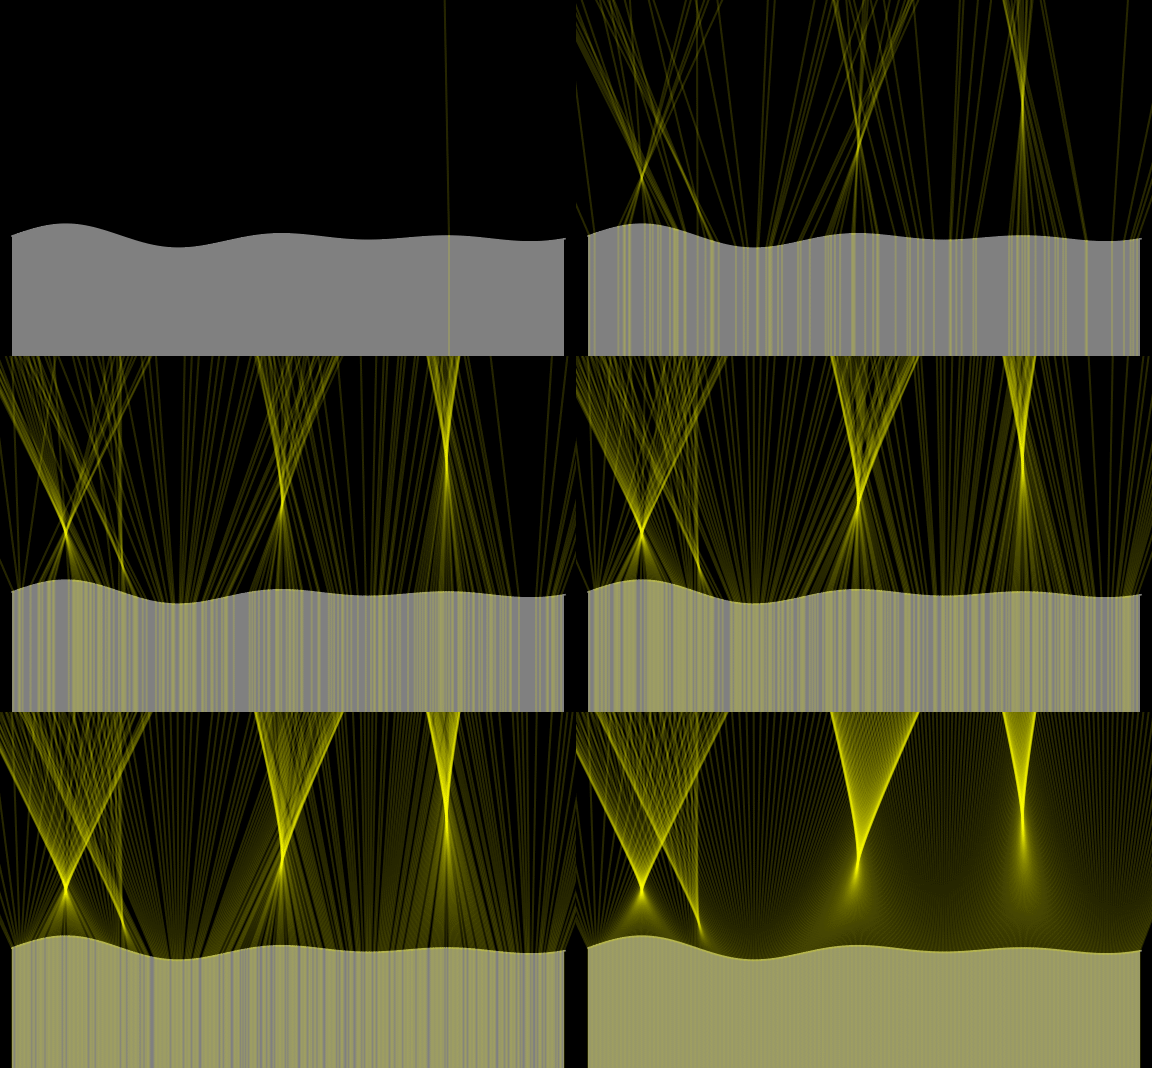
What happens? Light travels fast (very fast) but it will travel slower in water than in the air. A consequence of this is that a ray changes slightly its direction as it hits the water: the light ray is refracted. That is why a pen which is half immerged looks "as if" it is broken. In fact, it's only its image that gets distorted:

The laws governing this deviations are well known as Snell's law and state that
$$ \frac{\sin\theta_2}{\sin\theta_1} = \frac{n_1}{n_2} $$ Where $n_1\approx 1$ and $n_2\approx1.33$ are the refractive indices of air and water, respectively. (Note that, as a consequence, the light in the water is always slightly closer to the normal of the surface.)

Going back to the swimming pool, considering that the sun is emitting an uniform pattern of parallel rays from an incident angle $\theta_I$, we may apply this law to all of these light rays. The important ingredient is that the surface of the water (given as the surface height $z(x, y)$) changes smoothly and will deviate the light rays non-uniformly, thus creating the patterns. Writing down the equation, the displacement resulting from the angle of refraction is given by:
$$ \Delta x(x, y) = H \cdot \arcsin [ \frac 1 n \sin( \theta_I - \arctan(\frac{\partial}{\partial x} z(x, y)) + \arctan(\frac{\partial}{\partial x} z(x, y) ] $$
Where $H$ is the pool's depth, $n$ is the refractive index of water (that of air being set to $1$) and $\theta_I$ the incident angle. The same formula applies in the other spatial dimension $y$ by computing the angle of the surface along this dimension as $\arctan(\frac{\partial}{\partial y} z(x, y))$.
In the limit of a zenithal light source (that is, the sun at the vertical of the pool) and in the limit of small angles, the equations simplifies to: $$ \Delta x(x, y) \approx H' \cdot \frac{\partial z(x, y)}{\partial x} $$ and $$ \Delta y(x, y) \approx H' \cdot \frac{\partial z(x, y)}{\partial y} $$
with $ H' = \frac{n-1}{n} H$. What is interesting here is that we will transform an incoming "image" (here the uniform light source from the sun) by a set of small and local deformations of the support of the image. The equations are ultra-simple, but the consequences will paradoxically look complex.
Thinking about images as densities which we may discretize on a rectangular grid (in the __init__ function), it is very easy to generate a wave pattern ass a smooth surface in space and time (in the wave function), simulate the transformation on that surface (in the transform function) and compute the resulting image as an histogram (in the plot function):
class Caustique:
    def __init__(self, opt):
        """
        Image coordinates follow 'ij' indexing, that is,
        * their origin at the top left,
        * the X axis is vertical and goes "down",
        * the Y axis is horizontal and goes "right".

        """
        self.ratio = opt.ny/opt.nx # ratio between height and width (>1 for portrait, <1 for landscape)
        X = np.linspace(0, 1, opt.nx, endpoint=False) # vertical
        Y = np.linspace(0, self.ratio, opt.ny, endpoint=False) # horizontal
        self.xv, self.yv = np.meshgrid(X, Y, indexing='ij')
        self.opt = opt
        # https://stackoverflow.com/questions/16878315/what-is-the-right-way-to-treat-python-argparse-namespace-as-a-dictionary
        self.d = vars(opt)
        os.makedirs(self.opt.figpath, exist_ok=True)
        if self.opt.cache:
            self.cachepath = os.path.join('/tmp', self.opt.figpath)
            os.makedirs(self.cachepath, exist_ok=True)

        # a standard white:
        illuminant_D65 = xyz_from_xy(0.3127, 0.3291),
        illuminant_sun = xyz_from_xy(0.325998, 0.335354)
        # color conversion class
        self.cs_srgb = ColourSystem(red=xyz_from_xy(0.64, 0.33),
                               green=xyz_from_xy(0.30, 0.60),
                               blue=xyz_from_xy(0.15, 0.06),
                               white=illuminant_sun)
    def wave(self):
        filename = f'{self.cachepath}/{self.opt.tag}_wave.npy'
        if self.opt.cache and os.path.isfile(filename):
            z = np.load(filename)
        else:
            # A simplistic model of a wave using https://github.com/NeuralEnsemble/MotionClouds
            import MotionClouds as mc
            fx, fy, ft = mc.get_grids(self.opt.nx, self.opt.ny, self.opt.nframe)
            env = mc.envelope_gabor(fx, fy, ft, V_X=self.opt.V_Y, V_Y=self.opt.V_X, B_V=self.opt.B_V,
                                    sf_0=self.opt.sf_0, B_sf=self.opt.B_sf,
                                    theta=self.opt.theta, B_theta=self.opt.B_theta)
            z = mc.rectif(mc.random_cloud(env, seed=self.opt.seed))
            if self.opt.cache: np.save(filename, z)
        return z

    def transform(self, z_):
        xv, yv = self.xv.copy(), self.yv.copy()

        dzdx = z_ - np.roll(z_, 1, axis=0)
        dzdy = z_ - np.roll(z_, 1, axis=1)
        xv = xv + self.opt.H * dzdx
        yv = yv + self.opt.H * dzdy

        xv = np.mod(xv, 1)
        yv = np.mod(yv, self.ratio)

        return xv, yv

    def plot(self, z, gifname=None, dpi=150):
        if gifname is None:
            gifname=f'{self.opt.figpath}/{self.opt.tag}.gif'

        filename = f'{self.cachepath}/{self.opt.tag}_hist.npy'
        binsx, binsy = self.opt.nx//self.opt.bin_dens, self.opt.ny//self.opt.bin_dens
        if self.opt.cache and os.path.isfile(filename):
            hist = np.load(filename)
        else:
            hist = np.zeros((binsx, binsy, self.opt.nframe))
            for i_frame in range(self.opt.nframe):
                xv, yv = self.transform(z[:, :, i_frame])
                hist[:, :, i_frame], edge_x, edge_y = np.histogram2d(xv.ravel(), yv.ravel(),
                                                                     bins=[binsx, binsy],
                                                                     range=[[0, 1], [0, self.ratio]],
                                                                     density=True)
            hist /= hist.max()
            if self.opt.cache: np.save(filename, hist)

        subplotpars = matplotlib.figure.SubplotParams(left=0., right=1., bottom=0., top=1., wspace=0., hspace=0.,)
        fnames = []
        for i_frame in range(self.opt.nframe):
            fig, ax = plt.subplots(figsize=(binsy/dpi, binsx/dpi), subplotpars=subplotpars)
            bluesky = np.array([0.268375, 0.283377]) # xyz
            sun = np.array([0.325998, 0.335354]) # xyz
            # ax.pcolormesh(edge_y, edge_x, hist[:, :, i_frame], vmin=0, vmax=1, cmap=plt.cm.Blues_r)
            # https://en.wikipedia.org/wiki/CIE_1931_color_space#Mixing_colors_specified_with_the_CIE_xy_chromaticity_diagram
            L1 = 1 - hist[:, :, i_frame]
            L2 = hist[:, :, i_frame]
            image_denom = L1 / bluesky[1] + L2 / sun[1]
            image_x = (L1 * bluesky[0] / bluesky[1] + L2 * sun[0] / sun[1]) / image_denom
            image_y = (L1 + L2) / image_denom
            image_xyz = np.dstack((image_x, image_y, 1 - image_x - image_y))
            image_rgb = self.cs_srgb.xyz_to_rgb(image_xyz)
            image_L = self.opt.min_lum + (1-self.opt.min_lum)* L2 ** .61803

            ax.imshow(image_L[:, :, None]*image_rgb, vmin=0, vmax=1)

            fname = f'{self.cachepath}/{self.opt.tag}_frame_{i_frame}.png'
            fig.savefig(fname, dpi=dpi)
            fnames.append(fname)
            plt.close('all')

        return make_gif(gifname, fnames, fps=self.opt.fps)


# the rest is borrowed from https://github.com/gummiks/gummiks.github.io/blob/master/scripts/astro/planck.py
# as synthesized in https://laurentperrinet.github.io/sciblog/posts/2020-07-04-colors-of-the-sky.html

def planck(wav, T):
    import scipy.constants as const
    c = const.c # c = 3.0e+8
    h = const.h # h = 6.626e-34
    k = const.k # k = 1.38e-23
    a = 2.0*h*c**2
    b = h*c/(wav*k*T)
    intensity = a / ( (wav**5) * (np.exp(b) - 1.0) )
    return intensity

def scattering(wav, a=0.005, p=1.3, b=0.45):
    """
    b is  proportionate  to  the  column  density  of  aerosols
    along  the  path  of  sunlight,  from  outside  the  atmosphere
    to  the  point  of  observation

    N_O3  is  the  ozone  column  density  along  the  path  of  sunlight,
    sigma_O3 is  the  wavelength dependent ozone absorption cross-section.

    """
    # converting wav in µm:
    intensity = np.exp(-a/((wav/1e-6)**4)) # Rayleigh extinction by nitrogen
    intensity *= (wav/1e-6)**-4
    intensity *= np.exp(-b/((wav/1e-6)**p)) # Aerosols
    return intensity

def xyz_from_xy(x, y):
    """Return the vector (x, y, 1-x-y)."""
    return np.array((x, y, 1-x-y))

class ColourSystem:
    """A class representing a colour system.

    A colour system defined by the CIE x, y and z=1-x-y coordinates of
    its three primary illuminants and its "white point".

    TODO: Implement gamma correction

    """

    # CMF is the CIE colour matching function for 380 - 780 nm in 5 nm intervals

    def __init__(self, red, green, blue, white):
        """Initialise the ColourSystem object.

        Pass vectors (ie NumPy arrays of shape (3,)) for each of the
        red, green, blue  chromaticities and the white illuminant
        defining the colour system.

        """

        # Chromaticities
        self.red, self.green, self.blue = red, green, blue
        self.white = white
        # The chromaticity matrix (rgb -> xyz) and its inverse
        self.M = np.vstack((self.red, self.green, self.blue)).T
        self.MI = np.linalg.inv(self.M)
        # White scaling array
        self.wscale = self.MI.dot(self.white)
        # xyz -> rgb transformation matrix
        self.T = self.MI / self.wscale[:, np.newaxis]

        CMF_str = """380 0.0014 0.0000 0.0065
        385 0.0022 0.0001 0.0105
        390 0.0042 0.0001 0.0201
        395 0.0076 0.0002 0.0362
        400 0.0143 0.0004 0.0679
        405 0.0232 0.0006 0.1102
        410 0.0435 0.0012 0.2074
        415 0.0776 0.0022 0.3713
        420 0.1344 0.0040 0.6456
        425 0.2148 0.0073 1.0391
        430 0.2839 0.0116 1.3856
        435 0.3285 0.0168 1.6230
        440 0.3483 0.0230 1.7471
        445 0.3481 0.0298 1.7826
        450 0.3362 0.0380 1.7721
        455 0.3187 0.0480 1.7441
        460 0.2908 0.0600 1.6692
        465 0.2511 0.0739 1.5281
        470 0.1954 0.0910 1.2876
        475 0.1421 0.1126 1.0419
        480 0.0956 0.1390 0.8130
        485 0.0580 0.1693 0.6162
        490 0.0320 0.2080 0.4652
        495 0.0147 0.2586 0.3533
        500 0.0049 0.3230 0.2720
        505 0.0024 0.4073 0.2123
        510 0.0093 0.5030 0.1582
        515 0.0291 0.6082 0.1117
        520 0.0633 0.7100 0.0782
        525 0.1096 0.7932 0.0573
        530 0.1655 0.8620 0.0422
        535 0.2257 0.9149 0.0298
        540 0.2904 0.9540 0.0203
        545 0.3597 0.9803 0.0134
        550 0.4334 0.9950 0.0087
        555 0.5121 1.0000 0.0057
        560 0.5945 0.9950 0.0039
        565 0.6784 0.9786 0.0027
        570 0.7621 0.9520 0.0021
        575 0.8425 0.9154 0.0018
        580 0.9163 0.8700 0.0017
        585 0.9786 0.8163 0.0014
        590 1.0263 0.7570 0.0011
        595 1.0567 0.6949 0.0010
        600 1.0622 0.6310 0.0008
        605 1.0456 0.5668 0.0006
        610 1.0026 0.5030 0.0003
        615 0.9384 0.4412 0.0002
        620 0.8544 0.3810 0.0002
        625 0.7514 0.3210 0.0001
        630 0.6424 0.2650 0.0000
        635 0.5419 0.2170 0.0000
        640 0.4479 0.1750 0.0000
        645 0.3608 0.1382 0.0000
        650 0.2835 0.1070 0.0000
        655 0.2187 0.0816 0.0000
        660 0.1649 0.0610 0.0000
        665 0.1212 0.0446 0.0000
        670 0.0874 0.0320 0.0000
        675 0.0636 0.0232 0.0000
        680 0.0468 0.0170 0.0000
        685 0.0329 0.0119 0.0000
        690 0.0227 0.0082 0.0000
        695 0.0158 0.0057 0.0000
        700 0.0114 0.0041 0.0000
        705 0.0081 0.0029 0.0000
        710 0.0058 0.0021 0.0000
        715 0.0041 0.0015 0.0000
        720 0.0029 0.0010 0.0000
        725 0.0020 0.0007 0.0000
        730 0.0014 0.0005 0.0000
        735 0.0010 0.0004 0.0000
        740 0.0007 0.0002 0.0000
        745 0.0005 0.0002 0.0000
        750 0.0003 0.0001 0.0000
        755 0.0002 0.0001 0.0000
        760 0.0002 0.0001 0.0000
        765 0.0001 0.0000 0.0000
        770 0.0001 0.0000 0.0000
        775 0.0001 0.0000 0.0000
        780 0.0000 0.0000 0.0000"""
        CMF = np.zeros((len(CMF_str.split('\n')), 4))
        for i, line in enumerate(CMF_str.split('\n')):
            CMF[i, :] = np.fromstring(line, sep=' ')

        self.cmf = CMF

        self.wavelengths = np.linspace(200e-9, 2000e-9, 200)
        self.intensity5800 = planck(self.wavelengths, 5800.)
        self.intensity5800 /= self.intensity5800.max()
        self.intensitysky = self.intensity5800 * scattering(self.wavelengths)


    def xyz_to_rgb(self, xyz):
        """Transform from xyz to rgb representation of colour.

        The output rgb components are normalized on their maximum
        value. If xyz is out the rgb gamut, it is desaturated until it
        comes into gamut.

        By default, fractional rgb components are returned.

        """

        # rgb = self.T.dot(xyz)
        rgb = np.tensordot(xyz, self.T.T, axes=1)
        if np.any(rgb < 0):
            # We're not in the RGB gamut: approximate by desaturating
            w = - np.min(rgb)
            rgb += w
        if not np.all(rgb==0):
            # Normalize the rgb vector
            rgb /= np.max(rgb)

        return rgb

    def spec_to_xyz(self, spec):
        """Convert a spectrum to an xyz point.

        The spectrum must be on the same grid of points as the colour-matching
        function, self.cmf: 380-780 nm in 5 nm steps.

        """

        XYZ = np.sum(spec[:, np.newaxis] * self.cmf, axis=0)
        den = np.sum(XYZ)
        if den == 0.:
            return XYZ
        return XYZ / den

    def spec_to_rgb(self, spec, out_fmt=None):
        """Convert a spectrum to an rgb value."""

        xyz = self.spec_to_xyz(spec)
        return self.xyz_to_rgb(xyz, out_fmt)
a first instance
Let's generate a first instance of this caustic with the default parameters. Let's first have a look at the (simplistic) waveform we are using:
if not os.path.isfile(f'{opt.figpath}/{opt.tag}{mc.vext}'):
    print('Doing', f'{opt.figpath}/{opt.tag}.{mc.vext}')
    c = Caustique(opt)
    z = c.wave()
    mc.anim_save(z.swapaxes(0, 1), f'{opt.figpath}/{opt.tag}')
mc.in_show_video(f'{opt.tag}', figpath=opt.figpath)
It has many desirable properties: it is smooth in time and space, it is stochastic and periodic (no border effect). As such we may apply our simple transform and as a result we get:
gifname = f'{opt.figpath}/{opt.tag}.gif'
if not os.path.isfile(gifname):
    c = Caustique(opt)
    z = c.wave()
    gifname = c.plot(z)
display(Image(url=gifname, width=width))
This image ressembles the wiggling lines that we expected to find, great! Some properties:
- it is periodic in space and time by construction which may look unrealistic for a pool, but looks better as you do not have border effects...
- there are different classes of visual objects: veil-like smooth curves, traveling waves with a difference in their group/phase speed, nephroid-like intersection points, smooth gradients, ... which mainly depend on the surface's ondulation,
- when looking at this video long enough (I recommend opening this animated GIF in a separate tab and to zoom on it fullscreen), you may perceive some three-dimensionnal percepts, especially when some features change their speed..
exploring parameters
Is there more to see in our system? The first thing to do is to explore is the effect of the pool's depth:
N_scan = 9
base = 2
opt = init()
opt.tag = tag

c = Caustique(opt)
z = None
for H_ in c.opt.H*np.logspace(-1, 1, N_scan, base=base):
    print(f'H = {H_:.3f}')
    c.opt.H = H_
    gifname = f'{opt.figpath}/{opt.tag}_H_{H_:.3f}.gif'
    if not os.path.isfile(gifname):
        if z is None:
            z = c.wave()
        url=c.plot(z, gifname=gifname)
    display(Image(url=gifname, width=width))
This shows that for this waveform, there is an optimal depth to generate more concentrated caustics. This corresponds to the depth where the curvature of the waveform concentrates light as a lens. Note that at great distortions some ripples appear which are due to our sampling of space.
We may now explore the parameters of this waveform to see their effect on the resulting caustic:
opt = init()

for variable in ['sf_0', 'B_sf', 'theta', 'B_theta', 'V_X', 'V_Y', 'B_V']:
    print(f'======{variable}======')
    for modul in np.logspace(-1, 1, N_scan, base=base):
        opt = init()
        opt.tag = tag

        c = Caustique(opt)
        c.d[variable] *= modul

        print(f'{variable}={variable}(default)*{modul:.3f}={c.d[variable]:.3E}')
        gifname = f'{opt.figpath}/{opt.tag}_{variable}_modul_{modul:.3f}.gif'
        if not os.path.isfile(gifname):
            print('Doing ', gifname)
            z = c.wave()
            mcname = f'{opt.figpath}/{opt.tag}_{variable}_modul_{modul:.3f}'
            if not os.path.isfile(f'{mcname}{mc.vext}'):
                print('Doing ', f'{mcname}{mc.vext}')
                mc.anim_save(z.swapaxes(0, 1), f'{mcname}')
            url=c.plot(z, gifname=gifname)
        display(Image(url=gifname, width=width))
Future developments should:
- check if the approximation of small angles qualitatively changes the resulting images (should not, what maters is the transport of the density, not it's precision),
- use a more realistic waveform such as in https://laurentperrinet.github.io/sciblog/posts/2016-04-24_a-wave-going-backwards.html
- use different indices for different wavelengths (+add gamma correction for rendering),
- make it live (using pyglet for instance)
This development happens in https://github.com/NaturalPatterns/2020_caustiques - I am happy to welcome any people that would be interested in exploring this.
This shows that for this waveform, there is an optimal depth to generate more concentrated caustics. This corresponds to the depth for which the curvature of the waveform concentrates light as a lens.

