Computing sparseness of natural images with retina-like RFs
%load_ext autoreload
%autoreload 2
SparseEdges : computing sparseness of natural images with retina-like RFs
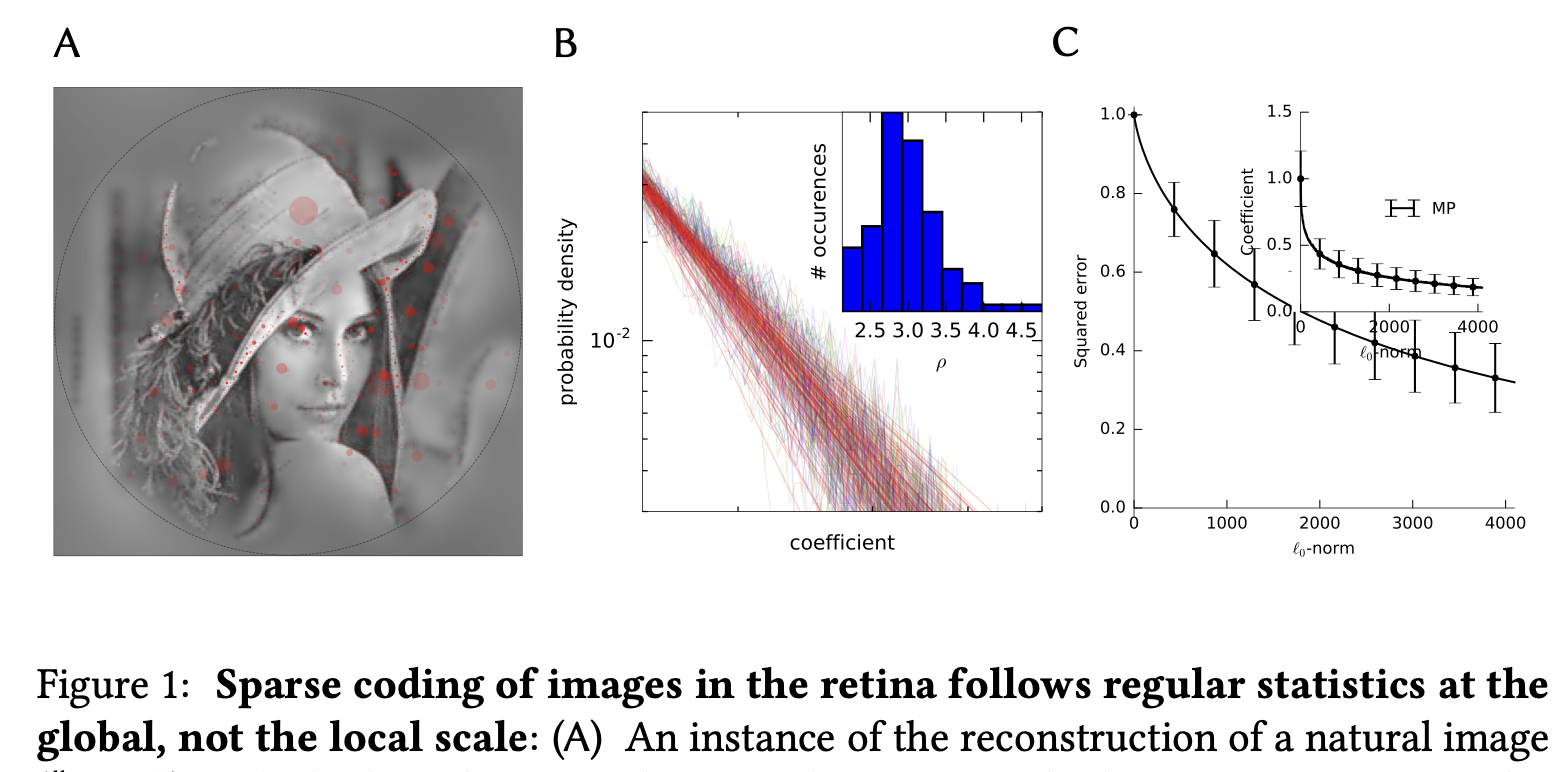
Natural images follow statistics inherited by the structure of our physical (visual) environment. In particular, a prominent facet of this structure is that images can be described by a relatively sparse number of features. To investigate the role of this sparseness in the efficiency of the neural code, we designed a new class of random textured stimuli with a controlled sparseness value inspired by measurements of natural images. Then, we tested the impact of this sparseness parameter on the firing pattern observed in a population of retinal ganglion cells recorded ex vivo in the retina of a rodent, the Octodon degus. These recordings showed in particular that the reliability of spike timings varies with respect to the sparseness with globally a similar trend than the distribution of sparseness statistics observed in natural images. These results suggest that the code represented in the spike pattern of ganglion cells may adapt to this aspect of the statistics of natural images.
Let's compute the "edges" produced with symmetrical filters.
Initialization
defining framework
from __future__ import division, print_function
import matplotlib.pyplot as plt
import numpy as np
np.set_printoptions(precision=2, suppress=True)
cluster = False
experiment = 'retina-sparseness'
name_database = 'serre07_distractors'
#parameter_file = '/Users/laurentperrinet/pool/science/BICV/SparseEdges/default_param.py'
parameter_file = 'https://raw.githubusercontent.com/bicv/SparseEdges/master/default_param.py'
#lena_file = '/Users/laurentperrinet/pool/science/BICV/SparseEdges//database/lena256.png'
lena_file = 'https://raw.githubusercontent.com/bicv/SparseEdges/master/database/lena256.png'
lena_file = '../../BICV/SparseEdges/database/lena256.png'
N_image = 100
N = 2**11
B_theta = np.inf
do_linear = False
from SparseEdges import SparseEdges
mp = SparseEdges(parameter_file)
mp.pe.N_X, mp.pe.N_Y = 64, 64
mp.pe.figpath, mp.pe.formats, mp.pe.dpi = 'figures', ['png', 'pdf', 'jpg'], 450
mp.init()
print ('Range of spatial frequencies: ', mp.sf_0)
mp.pe
import matplotlib
pylab_defaults = {
'font.size': 10,
'xtick.labelsize':'medium',
'ytick.labelsize':'medium',
'text.usetex': False,
'font.family' : 'sans-serif',
'font.sans-serif' : ['Helvetica'],
}
matplotlib.rcParams.update(pylab_defaults)
%matplotlib inline
import matplotlib.pyplot as plt
%config InlineBackend.figure_format='retina'
#%config InlineBackend.figure_format = 'svg'
fig_width_pt = 397.48 # Get this from LaTeX using \showthe\columnwidth
inches_per_pt = 1.0/72.27 # Convert pt to inches
fig_width = fig_width_pt*inches_per_pt # width in inches
#fig_width = 21
figsize=(fig_width, .618*fig_width)
#figpath, ext = os.path.join(os.getenv('HOME'), 'pool/science/RetinaClouds/2016-05-20_nips'), '.pdf'
Standard edges are oriented, but one may modify that:
sf_0 = .09 # TODO .1 cycle / pixel (Geisler)
params= {'sf_0':sf_0, 'B_sf': mp.pe.B_sf, 'theta':np.pi, 'B_theta': mp.pe.B_theta}
FT_lg = mp.loggabor(mp.pe.N_X/2, mp.pe.N_Y/2, **params)
#(fourier_domain(mp.normalize(np.absolute(FT_lg), center=False))+ image_domain(mp.normalize(mp.invert(FT_lg), center=False)))
fig, a1, a2 = mp.show_FT(FT_lg, axis=True, figsize=(fig_width, fig_width/2))
fig.tight_layout()
mp.savefig(fig, experiment + '_loggabor')

sf_0 = .06 # TODO .1 cycle / pixel (Geisler)
params= {'sf_0':sf_0, 'B_sf': mp.pe.B_sf, 'theta':0., 'B_theta': np.inf}
FT_lg = mp.loggabor(mp.pe.N_X/2, mp.pe.N_Y/2, **params)
fig, a1, a2 = mp.show_FT(FT_lg, axis=True, figsize=(fig_width, fig_width/2))
fig.tight_layout()
mp.savefig(fig, experiment + '_dog')

When defining the framework, one thus needs only one angle:
print ('Range of angles (in degrees): ', mp.theta*180./np.pi)
mp.pe.n_theta = 1
mp.pe.B_theta = np.inf
mp.init()
print ('Range of angles (in degrees): ', mp.theta*180./np.pi)
print('Final sparseness in the representation = {}'.format(mp.pe.N/mp.oc))
print('Final sparseness in the pyramid = {}'.format(mp.pe.N/(4/3*mp.pe.N_X*mp.pe.N_Y)))
one example image
mp = SparseEdges(parameter_file)
mp.pe.figpath, mp.pe.formats, mp.pe.dpi = 'figures', ['png', 'pdf', 'jpg'], 450
image = mp.imread(lena_file)
mp.pe.N = N
mp.pe.do_mask = True
mp.pe.n_theta = 1
mp.pe.B_theta = B_theta
mp.pe.line_width = 0
mp.pe.mask_exponent = 4.
mp.init()
image = mp.normalize(image, center=False)
image *= mp.mask
print(image.min(), image.max())
fig, ax = mp.imshow(image, mask=True, norm=False)

name = experiment.replace('sparseness', 'lena')
matname = os.path.join(mp.pe.matpath, name + '.npy')
try:
edges = np.load(matname)
except:
edges, C_res = mp.run_mp(image, verbose=False)
np.save(matname, edges)
matname = os.path.join(mp.pe.matpath, name + '_rec.npy')
try:
image_rec = np.load(matname)
except:
image_rec = mp.reconstruct(edges, mask=True)
np.save(matname, image_rec)
print(matname)
#mp.pe.line_width = 0
fig, a = mp.show_edges(edges, image=mp.dewhitening(image_rec), show_phase=False, mask=True)
mp.savefig(fig, name)

#list_of_number_of_edge = np.logspace(0, 11, i, base=2)
#list_of_number_of_edge = 4**np.arange(6)
list_of_number_of_edge = 2* 4**np.arange(6)
list_of_number_of_edge = 64* 2**np.arange(6)
print(list_of_number_of_edge)
fig, axs = plt.subplots(1, len(list_of_number_of_edge), figsize=(3*fig_width, 3*fig_width/len(list_of_number_of_edge)))
vmax = 1.
image_rec = mp.reconstruct(edges, mask=True)
vmax = mp.dewhitening(image_rec).max()
for i_ax, number_of_edge in enumerate(list_of_number_of_edge):
edges_ = edges[:, :number_of_edge][..., np.newaxis]
image_rec = mp.dewhitening(mp.reconstruct(edges_, mask=True))
fig, axs[i_ax] = mp.imshow(image_rec/vmax, fig=fig, ax=axs[i_ax], norm=False, mask=True)
axs[i_ax].text(5, 29, 'N=%d' % number_of_edge, color='red', fontsize=24)
plt.tight_layout()
fig.subplots_adjust(hspace = .0, wspace = .0, left=0.0, bottom=0., right=1., top=1.)
mp.savefig(fig, name + '_movie')

Running simulations on a set of natural images
%%writefile experiment_sparseness.py
# -*- coding: utf8 -*-
from __future__ import division, print_function
"""
$ python experiment_sparseness.py
to remove the cached files:
rm -fr **/SparseLets* **/**/SparseLets*
"""
import sys
experiment = sys.argv[1]
parameter_file = sys.argv[2]
name_database = sys.argv[3]
N_image = int(sys.argv[4])
print('N_image', N_image)
N = int(sys.argv[5])
do_linear = (sys.argv[6] == 'True')
import numpy as np
from SparseEdges import SparseEdges
mps = []
for name_database in [name_database]:
mp = SparseEdges(parameter_file)
mp.pe.figpath, mp.pe.formats, mp.pe.dpi = 'figures', ['png', 'pdf', 'jpg'], 450
mp.pe.datapath = 'database/'
mp.pe.N_image = N_image
mp.pe.do_mask = True
mp.pe.N = N
mp.pe.n_theta = 1
mp.pe.B_theta = np.inf
mp.init()
# normal experiment
imageslist, edgeslist, RMSE = mp.process(exp=experiment, name_database=name_database)
mps.append(mp)
# control experiment
if do_linear:
mp.pe.MP_alpha = np.inf
mp.init()
imageslist, edgeslist, RMSE = mp.process(exp=experiment + '_linear', name_database=name_database)
mps.append(mp)
if cluster:
for cmd in [
"frioul_list_jobs -v |grep job_array_id |uniq -c",
]:
print(run_on_cluster(cmd))
experiment_folder = experiment = 'retina-sparseness'
cluster = True
cluster = False
do_update = True
do_update = False
do_cleanup = False
do_cleanup = True
do_run = False
do_run = True
experiments = [experiment]
def run_cmd(cmd, doit=True):
import subprocess
print ('⚡︎ Running ⚡︎ ', cmd)
if doit:
stdout = subprocess.check_output([cmd], shell=True)
return stdout.decode()#.splitlines()
SERVER = 'perrinet.l@frioul.int.univ-amu.fr'
PATH = '/hpc/invibe/perrinet.l/science/{}/'.format(experiment_folder)
def push_to_cluster(source="{results,data_cache,experiment_sparseness.py,database}",
PATH=PATH, SERVER=SERVER,
opts="-av -u --exclude .AppleDouble --exclude .git"):
fullcmd = 'ssh {} "mkdir -p {} " ; '.format(SERVER, PATH)
fullcmd += 'rsync {} {} {}:{} '.format(opts, source, SERVER, PATH)
return run_cmd (fullcmd)
def run_on_cluster(cmd, PATH=PATH, SERVER=SERVER):
import subprocess
fullcmd = 'ssh {SERVER} "cd {PATH} ; {cmd} "'.format(SERVER=SERVER, PATH=PATH, cmd=cmd)
return run_cmd (fullcmd)
def pull_from_cluster(source="{results,data_cache,debug.log}", dest=".",
PATH=PATH, SERVER=SERVER,
opts="-av -u --delete --exclude .AppleDouble --exclude .git"):
fullcmd = 'rsync {} {}:{}{} {} '.format(opts, SERVER, PATH, source, dest)
return run_cmd (fullcmd)
# update
if cluster and do_update:
print(run_on_cluster("frioul_batch 'cd /hpc/invibe/perrinet.l/science/SparseEdges/; make update_dev'"))
# clean-up
if cluster and do_cleanup:
push_to_cluster()
for cmd in [
#"rm -fr results data_cache ",
"find . -name *lock* -exec rm -fr {} \\;",
"touch frioul; rm frioul* ",
]:
print(run_on_cluster(cmd))
# RUNNING
if do_run:
if cluster:
fullcmd = 'ipython experiment_sparseness.py {experiment} {parameter_file} {name_database} {N_image} {N} {do_linear} '.format(
experiment=experiment, parameter_file=parameter_file,
name_database=name_database, N_image=N_image, N=N, do_linear=do_linear)
for cmd in [
"frioul_batch -M 136 '{}' ".format(fullcmd),
"frioul_list_jobs -v |grep job_array_id |uniq -c",
]:
print(run_on_cluster(cmd))
else:
fullcmd = 'ipython3 experiment_sparseness.py {experiment} {parameter_file} {name_database} {N_image} {N} {do_linear} '.format(
experiment=experiment, parameter_file=parameter_file,
name_database=name_database, N_image=N_image, N=N, do_linear=do_linear)
run_cmd (fullcmd)
import time, os
# GETTING the data
import time, os
while True:
if cluster:
print(pull_from_cluster())
print(run_on_cluster("tail -n 10 {}".format(os.path.join(PATH, 'debug.log'))))
print(run_on_cluster("frioul_list_jobs -v |grep job_array_id |uniq -c"))
locks = run_cmd ("find . -name *lock -exec ls -l {} \;")
print(locks)
if len(locks) == 0: break
time.sleep(100)
!ssh perrinet.l@frioul.int.univ-amu.fr "python -c'import numpy as np; print(np.pi)'"
%%bash
ssh perrinet.l@frioul.int.univ-amu.fr "python -c'import numpy as np; print(np.pi)'"
Analysing results
First, we retrieve edges from a prior edge extraction
name_database='serre07_distractors'
imageslist, edgeslist, RMSE = mp.process(exp=experiment, name_database=name_database)
%run experiment_sparseness.py retina-sparseness https://raw.githubusercontent.com/bicv/SparseEdges/master/default_param.py serre07_distractors 100 2048 False
imageslist, edgeslist, RMSE = mp.process(exp=experiment, name_database=name_database)
edgeslist
fig, [A, B] = plt.subplots(1, 2, figsize=(fig_width, fig_width/1.618), subplot_kw={'axisbg':'w'})
A.set_color_cycle(np.array([[1., 0., 0.]]))
imagelist, edgeslist, RMSE = mp.process(exp=experiment, name_database=name_database)
RMSE /= RMSE[:, 0][:, np.newaxis]
#print( RMSE.shape, edgeslist.shape)
value = edgeslist[4, ...]
#value /= value[0, :][np.newaxis, :]
value /= RMSE[:, 0][np.newaxis, :]
B.semilogx( value, alpha=.7)
A.semilogx( RMSE.T, alpha=.7)
A.set_xlabel('l0')
B.set_xlabel('l0')
A.axis('tight')
B.axis('tight')
_ = A.set_ylabel('RMSE')
#plt.locator_params(axis = 'x', nbins = 5)
#plt.locator_params(axis = 'y', nbins = 5)
mp.savefig(fig, experiment + '_raw')

imagelist, edgeslist, RMSE = mp.process(exp=experiment + '_linear', name_database=name_database)
RMSE /= RMSE[:, 0][:, np.newaxis]
print(RMSE, RMSE.shape, edgeslist.shape)
fig = plt.figure(figsize=(fig_width/1.618, fig_width/1.618))
if do_linear:
fig, ax, inset = mp.plot(mps=[mp, mp], experiments=[experiment, experiment + '_linear'],
databases=[name_database, name_database], fig=fig,
color=[0., 0., 1.], scale=False, labels=['MP', 'lin'])
else:
fig, ax, inset = mp.plot(mps=[mp], experiments=[experiment], databases=[name_database], fig=fig,
color=[0., 0., 1.], scale=False, labels=['MP'])
mp.savefig(fig, experiment + '_raw_inset')

imagelist, edgeslist, RMSE = mp.process(exp=experiment, name_database=name_database)
value = edgeslist[4, ...].T
#value /= RMSE[:, 0][np.newaxis, :]
value /= RMSE[:, 0][:, np.newaxis]
#RMSE /= RMSE[:, 0][:, np.newaxis]
N_image, N = RMSE.shape #number of images x edges
#value = value.T
imagelist, edgeslist, RMSE = mp.process(exp=experiment, name_database=name_database)
value = edgeslist[4, ...]
value /= RMSE[:, 0][np.newaxis, :]
#RMSE /= RMSE[:, 0][:, np.newaxis]
N = RMSE.shape[1] #number of edges
value = value.T
print(value.shape, RMSE.shape)
fig, ax = plt.subplots(1, 1, figsize=(fig_width, fig_width/1.618), subplot_kw={'axisbg':'w'})
from lmfit.models import ExpressionModel
mod = ExpressionModel('amplitude * exp ( - .5 * log(x+1)**2 / rho **2 )')
verbose = False
amplitude, rho = np.zeros(N_image), np.zeros(N_image)
for i_image in range(RMSE.shape[0]):
#pars = mod.guess(RMSE[i_image, :], x=np.arange(N))
mod.def_vals = {'amplitude':.01, 'rho':100}
params = mod.make_params()
out = mod.fit(value[i_image, :], x=np.arange(N), verbose=verbose, params=params)#, weights=np.exp(- np.arange(N) / 200))
#print(out.params)
#print(out.fit_report())
amplitude[i_image] = out.params.get('amplitude').value
rho[i_image] = out.params.get('rho').value
ax.loglog( value[i_image, :], alpha=.2)
params = mod.make_params(amplitude=amplitude[i_image], rho=rho[i_image])
ax.loglog(mod.eval(params, x=np.arange(N)), 'r--', alpha=.2)
ax.set_xlabel('l0')
ax.axis('tight')
_ = ax.set_ylabel('coefficient')

fig, ax = plt.subplots(1, 1, figsize=(fig_width, fig_width/1.618), subplot_kw={'axisbg':'w'})
for i_image in range(N_image):
ax.loglog( value[i_image, :], alpha=.2)
params = mod.make_params(amplitude=amplitude[i_image], rho=rho[i_image])
ax.loglog(mod.eval(params, x=np.arange(N)), 'r--', alpha=.2)
ax.set_xlabel('l0')
ax.axis('tight')
_ = ax.set_ylabel('coefficient')
mp.savefig(fig, experiment + '_fit_all')
fig, axs = plt.subplots(1, 3, figsize=(fig_width, fig_width/1.618), subplot_kw={'axisbg':'w'})
axs[0].hist(amplitude)
axs[1].hist(np.abs(rho))
axs[2].scatter(amplitude, np.abs(rho))
for ax in axs:
ax.axis('tight')
_ = ax.set_ylabel('')
_ = ax.set_yticks([])
axs[0].set_ylabel('probability')
axs[0].set_xlabel('amplitude')
axs[1].set_xlabel('rho')
axs[2].set_xlabel('amplitude')
axs[2].set_ylabel('rho')
fig.tight_layout()
mp.savefig(fig, experiment + '_fit_hist')

fig, axs = plt.subplots(1, 1, figsize=(fig_width/2.618, fig_width/1.618), subplot_kw={'axisbg':'w'})
axs.hist(np.abs(rho))
axs.axis('tight')
_ = axs.set_ylabel('')
_ = axs.set_yticks([])
axs.set_ylabel('probability')
axs.set_xlabel('amplitude')
fig.tight_layout()
mp.savefig(fig, experiment + '_fit_hist')

on the pdf
value.max(axis=1).shape
%pwd
#imagelist, edgeslist, RMSE = mp.process(exp=experiment + '_linear', name_database=name_database)
#imagelist, edgeslist, RMSE = mp.process(exp=experiment, name_database=name_database)
edgeslist = np.load('data_cache/edges/' + experiment + '_' + name_database + '_edges.npy')
value = edgeslist[4, ...].T
#value /= RMSE[:, 0][np.newaxis, :]
value /= value.min(axis=1)[:, np.newaxis]
#RMSE /= RMSE[:, 0][:, np.newaxis]
N_image, N = value.shape #number of images x edges
#value = value.T
N_bins, a_max = 128, value.max()
start, end = N_bins//16, N_bins
print(a_max)
v_hist = np.zeros((N_image, N_bins))
#bins = np.linspace(0, a_max, N_bins+1, endpoint=True)#[:-1]
#print(bins.shape)
for i_image in range(N_image):
#v_hist[i_image, : ], v_bins = np.histogram(value[i_image, :], bins=bins)
v_hist[i_image, : ], v_bins = np.histogram(value[i_image, :], bins=N_bins)
v_hist[i_image, : ] /= v_hist[i_image, : ].sum()
print(v_bins.shape)
v_middle = .5*(v_bins[1:]+v_bins[:-1])
plt.plot(v_bins[1:], v_middle)
print(v_bins[0], v_middle[0])
print(v_bins[0], v_middle[0])
print(start, end)

MLE estimate of rho: https://en.wikipedia.org/wiki/Power_law#Maximum_likelihood
amplitude, rho = np.zeros(N_image), np.zeros(N_image)
for i_image in range(N_image):
rho[i_image] = 1 + (end-start) / np.sum(np.log(value[i_image, start:end]))
amplitude[i_image] = rho[i_image] - 1
print(rho)
import lmfit
from lmfit import Model
def model(x, A, x_0, B):
f = A / x * np.exp( -.5 * np.log(x/x_0)**2 / B**2 )
#f /= f.sum()
return f
weights = np.linspace(0, 1, N_bins)
weights = np.linspace(1, 0, N_bins)
weights = np.ones(N_bins)
verbose = False
A, x_0, B = np.zeros(N_image), np.zeros(N_image), np.zeros(N_image)
for i_image in range(N_image):
mod = Model(model)
mod.set_param_hint('A', value=.05, min=0.)
#mod.set_param_hint('x_0', value=.45, min=0.45, max=0.46)
mod.set_param_hint('x_0', value=.5, min=0.)
mod.set_param_hint('B', value=1.9, min=0.)
valid = (v_hist[i_image, :] > 0.)
out = mod.fit(v_hist[i_image, valid], x=v_middle[valid],
verbose=verbose, weights=weights[valid], method='leastsq', maxfev=1e6)
if verbose: print(out.fit_report())
A[i_image] = out.params.get('A').value
x_0[i_image] = out.params.get('x_0').value
B[i_image] = out.params.get('B').value
print ('A=', A.mean(), ', +/- ', A.std())
print ('x_0=', x_0.mean(), ', +/- ', x_0.std())
print ('B=', B.mean(), ', +/- ', B.std())
fig, ax = plt.subplots(1, 1, figsize=(fig_width, fig_width/1.618), subplot_kw={'axisbg':'w'})
for i_image in range(N_image):
ax.plot(v_middle[valid], v_hist[i_image, valid], '.', alpha=.2)
valid = (v_hist[i_image, :] > 0.)
#params = mod.make_params(A=A[i_image], x_0=x_0[i_image], B=B[i_image])
#ax.plot(v_middle[valid], mod.eval(params, x=v_middle[valid]), 'r', alpha=.2)
ax.plot(v_middle[valid], model(v_middle[valid], A=A[i_image], x_0=x_0[i_image], B=B[i_image]), 'r', alpha=.2)
ax.set_yscale('log')
ax.set_xscale('log')
ax.axis('tight')
#ax.set_xlim(a_min, a_max)
ax.set_ylim(.0003, .1)
ax.set_ylabel('density')
ax.set_xlabel('coefficient')
mp.savefig(fig, experiment + '_proba')

import lmfit
from lmfit import Model
def model(x, A, rho):
f = A / x ** rho
#f /= f.sum()
return f
weights = np.linspace(1, 0, N_bins)
weights = np.linspace(0, 1, N_bins)
weights = np.ones(N_bins)
verbose = False
A, rho = np.zeros(N_image), np.zeros(N_image)
for i_image in range(N_image):
mod = Model(model)
mod.set_param_hint('A', value=.05, min=0.)
mod.set_param_hint('rho', value=2.5, min=1.)
valid = (v_hist[i_image, :] > 0.)
out = mod.fit(v_hist[i_image, valid], x=v_middle[valid],
verbose=verbose, weights=weights[valid], method='leastsq', maxfev=1e6)
if verbose: print(out.fit_report())
A[i_image] = out.params.get('A').value
rho[i_image] = out.params.get('rho').value
print ('A=', A.mean(), ', +/- ', A.std())
print ('rho=', rho.mean(), ', +/- ', rho.std())
fig, ax = plt.subplots(1, 1, figsize=(fig_width, fig_width/1.618), subplot_kw={'axisbg':'w'})
for i_image in range(N_image):
ax.plot(v_middle[valid], v_hist[i_image, valid], '.', alpha=.2)
valid = (v_hist[i_image, :] > 0.)
ax.plot(v_middle[valid], model(v_middle[valid], A=A[i_image], rho=rho[i_image]), 'r', alpha=.2)
ax.set_yscale('log')
ax.set_xscale('log')
ax.axis('tight')
ax.set_ylabel('density')
ax.set_xlabel('coefficient')
mp.savefig(fig, experiment + '_proba')

from lmfit.models import ExpressionModel
mod = ExpressionModel('amplitude * x**-rho ')
#mod = ExpressionModel('amplitude * exp( - log(x)**2/rho**2 ) ')
#mod = ExpressionModel('amplitude * exp( - x/rho ) ')
verbose = False
for i_image in range(N_image):
#pars = mod.guess(RMSE[i_image, :], x=np.arange(N))
mod.def_vals = {'amplitude': amplitude[i_image], 'rho': rho[i_image]}
params = mod.make_params()
out = mod.fit(v_hist[i_image, start:end], x=v_middle[start:end], verbose=verbose)
#print(out.fit_report())
amplitude[i_image] = out.params.get('amplitude').value
rho[i_image] = out.params.get('rho').value
print(rho)
fig, ax = plt.subplots(1, 1, figsize=(fig_width/3, fig_width/3), subplot_kw={'axisbg':'w'})
for i_image in range(N_image):
ax.plot(v_middle, v_hist[i_image, :], alpha=.2)
params = mod.make_params(amplitude=amplitude[i_image], rho=rho[i_image])
ax.plot(v_middle[start:end], mod.eval(params, x=v_middle[start:end]), 'r.', alpha=.2)
if True:
ax.set_yscale('log')
ax.set_xscale('log')
ax.axis('tight')
ax.set_xlim(1.5, 5)
ax.set_ylim(.0003, .05)
ax.set_ylabel('density')
ax.set_xlabel('coefficient')
mp.savefig(fig, experiment + '_proba')

fig, axs = plt.subplots(1, 1, figsize=(fig_width/3, fig_width/3), subplot_kw={'axisbg':'w'})
axs.hist(np.abs(rho), bins=np.linspace(2, 4, 5))
axs.axis('tight')
_ = axs.set_ylabel('')
_ = axs.set_yticks([])
axs.set_ylabel('probability density')
axs.set_xlabel(r'$\rho$')
fig.tight_layout()
mp.savefig(fig, experiment + '_fit_hist')

#fig, ax = plt.subplots(1, 1, figsize=(fig_width/2, fig_width/2), subplot_kw={'axisbg':'w'})
fig = plt.figure(figsize=(fig_width/2, fig_width/2))
ax = fig.add_axes([0.18, 0.15, .8, .8], axisbg='w')
for i_image in range(N_image):
ax.plot(v_middle, v_hist[i_image, :], '-', alpha=.1, lw=.5)
params = mod.make_params(amplitude=amplitude[i_image], rho=rho[i_image])
ax.plot(v_middle[start:end], mod.eval(params, x=v_middle[start:end]), 'r', alpha=.2, lw=.5)
if True:
ax.set_yscale('log')
ax.set_xscale('log')
ax.axis('tight')
ax.set_xlim(1.5, 5.)
ax.set_ylim(.003, .05)
ax.set_ylabel('probability density')
ax.set_xlabel('coefficient')
inset = fig.add_axes([0.58, 0.55, .4, .4], axisbg='w')
inset.hist(np.abs(rho))
inset.axis('tight')
_ = inset.set_ylabel('')
_ = inset.set_yticks([])
inset.set_ylabel('# occurences')
inset.set_xlabel(r'$\rho$')
#fig.subplots_adjust(left=0.22, bottom=0.1, right=.9, top=.9)
mp.savefig(fig, experiment + '_proba_inset')

TODO : do the same for experiment + '_linear'
rho_0 = rho.mean()
print(rho_0)
v_hist_scale = np.zeros((N_image, N_bins))
for i_image in range(N_image):
#v_hist[i_image, : ], v_bins = np.histogram(value[i_image, :], bins=bins)
v_hist_scale[i_image, : ], v_bins = np.histogram(value[i_image, :]**((rho_0-1)/(rho[i_image]-1)), bins=N_bins)
v_hist_scale[i_image, : ] /= v_hist_scale[i_image, : ].sum()
amplitude_scale, rho_scale = np.zeros(N_image), np.zeros(N_image)
for i_image in range(N_image):
mod.def_vals = {'amplitude': amplitude[i_image], 'rho': rho[i_image]}
params = mod.make_params()
out = mod.fit(v_hist_scale[i_image, start:end], x=v_middle[start:end], verbose=verbose)
amplitude_scale[i_image] = out.params.get('amplitude').value
rho_scale[i_image] = out.params.get('rho').value
print(rho_scale)
fig, ax = plt.subplots(1, 1, figsize=(fig_width, fig_width/1.618), subplot_kw={'axisbg':'w'})
for i_image in range(N_image):
ax.plot(v_middle, v_hist_scale[i_image, :], alpha=.2)
params = mod.make_params(amplitude=amplitude_scale[i_image], rho=rho_scale[i_image])
ax.plot(v_middle[start:end], mod.eval(params, x=v_middle[start:end]), 'r.', alpha=.2)
if True:
ax.set_yscale('log')
ax.set_xscale('log')
ax.set_xlim(1.25, 4)
ax.set_ylim(.0009, .05)
ax.set_ylabel('density')
ax.set_xlabel('coefficient')
mp.savefig(fig, experiment + '_proba_scaled')

plt.hist(rho_scale)

DropLets
from scipy.stats import powerlaw
N_sparse = 6
sparseness = np.linspace(2, 7, N_sparse, endpoint=True)
N_edge = N
fig , ax = plt.subplots()
bins= np.linspace(1, 10, 100)
for a in sparseness:
#s = np.random.power(a=a, size=N_edge)
s = 1/powerlaw.rvs(a=a, size = N_edge)
hist, bins_ = np.histogram(s, bins=bins)
ax.loglog(bins[1:], hist, label=a)
ax.legend()

frames =[]
for a in sparseness:
frames.append(mp.texture( N_edge=N_edge, a=a, randn=False))
fig, axs = plt.subplots(1, N_sparse, sharex=True, sharey=True)
fig.set_size_inches(fig_width, 1.2*fig_width/N_sparse)
for i_sparse in range( N_sparse):
vmax=np.abs(frames[i_sparse]).max()
vmin=-vmax
axs[i_sparse].imshow(frames[i_sparse], origin='lower', cmap='gray', vmin=vmin, vmax=vmax, interpolation='none')
axs[i_sparse].axis('tight')
axs[i_sparse].set_xticks([])
axs[i_sparse].set_yticks([])
axs[i_sparse].set_title(label = r'$\rho=%.0f$' % sparseness[i_sparse])
fig.tight_layout()
fig.subplots_adjust(left=0, bottom=0, right=1, top=.8, wspace=0, hspace=0)
mp.savefig(fig, 'droplets')

import numpy as np
import MotionClouds as mc
import matplotlib.pyplot as plt
# PARAMETERS
seed = 2042
np.random.seed(seed=seed)
N_sparse = 5
sparse_base = 2.e5
sparseness = np.logspace(-1, 0, N_sparse, base=sparse_base, endpoint=True)
print(sparseness)
# TEXTON
N_X, N_Y, N_frame = 256, 256, 1
fx, fy, ft = mc.get_grids(N_X, N_Y, 1)
mc_i = mc.envelope_gabor(fx, fy, ft, sf_0=0.05, B_sf=0.025, B_theta=np.inf)
#print(ft.shape)
#print(mc_i.shape)
#fig, axs = plt.subplots(1, 1, figsize=(fig_width, fig_width))
#axs.imshow(mc.envelope_speed(fx, fy, ft)[:, :, 0], vmin=-1, vmax=1, cmap=plt.gray())
#texton = 2*mc.rectif(mc.random_cloud(mc_i, impulse=True))-1
#fig, axs = plt.subplots(1, 1, figsize=(fig_width, fig_width))
#axs.imshow(texton[:, :, 0], vmin=-1, vmax=1, cmap=plt.gray())
values = np.random.randn(N_X, N_Y, N_frame)
#a = 2.
#values = np.random.pareto(a=a, size=(N_X, N_Y, N_frame)) + 1
#values *= np.sign(np.random.randn(N_X, N_Y, N_frame))
#chance = np.random.rand(N_X, N_Y, N_frame)
chance = np.argsort(-np.abs(values.ravel()))
#fig, axs = plt.subplots(1, 1, figsize=(fig_width, fig_width))
#axs.plot(np.abs(values.ravel())[chance])
chance = np.array(chance, dtype=np.float)
chance /= chance.max()
chance = chance.reshape((N_X, N_Y, N_frame))
#print(chance.min(), chance.max())
#fig, axs = plt.subplots(1, 1, figsize=(fig_width, fig_width))
#axs.imshow(chance[:, :, 0], vmin=0, vmax=1, cmap=plt.gray())
fig, axs = plt.subplots(1, N_sparse, figsize=(fig_width, fig_width/N_sparse))
for i_ax, l0_norm in enumerate(sparseness):
threshold = 1 - l0_norm
mask = np.zeros_like(chance)
mask[chance > threshold] = 1.
im = 2*mc.rectif(mc.random_cloud(mc_i, events=mask*values))-1
axs[i_ax].imshow(im[:, :, 0], vmin=-1, vmax=1, cmap=plt.gray())
#axs[i_ax].text(9, 80, r'$n=%.0f\%%$' % (noise*100), color='white', fontsize=10)
axs[i_ax].text(4, 40, r'$\epsilon=%.0e$' % l0_norm, color='white', fontsize=8)
axs[i_ax].set_xticks([])
axs[i_ax].set_yticks([])
plt.tight_layout()
fig.subplots_adjust(hspace = .0, wspace = .0, left=0.0, bottom=0., right=1., top=1.)
# plt.savefig(fig, experiment + '_droplets')

modeling different sparseness exponents in a natural image
!ls data_cache/retina-lena.npy
print(mp.pe.matpath)
name = experiment.replace('sparseness', 'lena')
matname = os.path.join(mp.pe.matpath, name + '.npy')
N_rho = 3
fig, axs = plt.subplots(1, N_rho, figsize=(fig_width, fig_width/N_rho))
vmax = 1.
for i_ax, rho in enumerate(np.logspace(-1, 1, N_rho, base=2)):
edges = np.load(matname)
edges[4, :] = edges[4, :] ** rho
image_rec = mp.dewhitening(mp.reconstruct(edges, mask=True))
fig, axs[i_ax] = mp.imshow(image_rec/vmax, fig=fig, ax=axs[i_ax], norm=False, mask=True)
axs[i_ax].text(5, 29, r'$\rho=%.1f$' % rho, color='red', fontsize=16)
plt.tight_layout()
fig.subplots_adjust(hspace = .0, wspace = .0, left=0.0, bottom=0., right=1., top=1.)
mp.savefig(fig, name + '_rescale')
some book keeping for the notebook
%reload_ext watermark
%watermark -i -h -m -v -p MotionClouds,numpy,SLIP,LogGabor,SparseEdges,matplotlib,scipy,pillow,imageio